
One average, two truths
Under the campaigns in a report sits a "Total" row: CTR, CPC, CPM, engagement rate. Surprisingly often those values are the mean of each row's rate. It is quick, and for rates it frequently produces the wrong number.
The reason: a rate is a fraction, such as clicks over impressions or spend over clicks. Averaging fractions ignores the denominators. A campaign with a million impressions then counts exactly as much as a small test with ten thousand. When rows differ in size, the error can be larger than any difference we actually wanted to discuss.
Below: how to combine rates correctly, when even a correct total misleads, and why small samples do not belong in rankings.
Worked example: two campaigns, two answers
Say two campaigns run in the same month:
| Impressions | Clicks | Spend | CTR | CPC | CPM | |
|---|---|---|---|---|---|---|
| Campaign A | 1,000,000 | 5,000 | €15,000 | 0.50% | €3.00 | €15.00 |
| Campaign B | 10,000 | 300 | €600 | 3.00% | €2.00 | €60.00 |
The simple mean of the two CTRs is (0.50% + 3.00%) / 2 = 1.75%. The actual CTR across both campaigns: 5,300 clicks on 1,010,000 impressions, which is 0.52%. The average is more than three times higher than what really happened.
CPC goes wrong in the other direction. Averaged: €2.50. Actual: €15,600 of spend on 5,300 clicks, which is €2.94. And CPM: the mean is €37.50, the actual figure €15,600 on 1,010,000 impressions, which is €15.45. The cause is the same every time: Campaign B is tiny but counts for half of the mean.
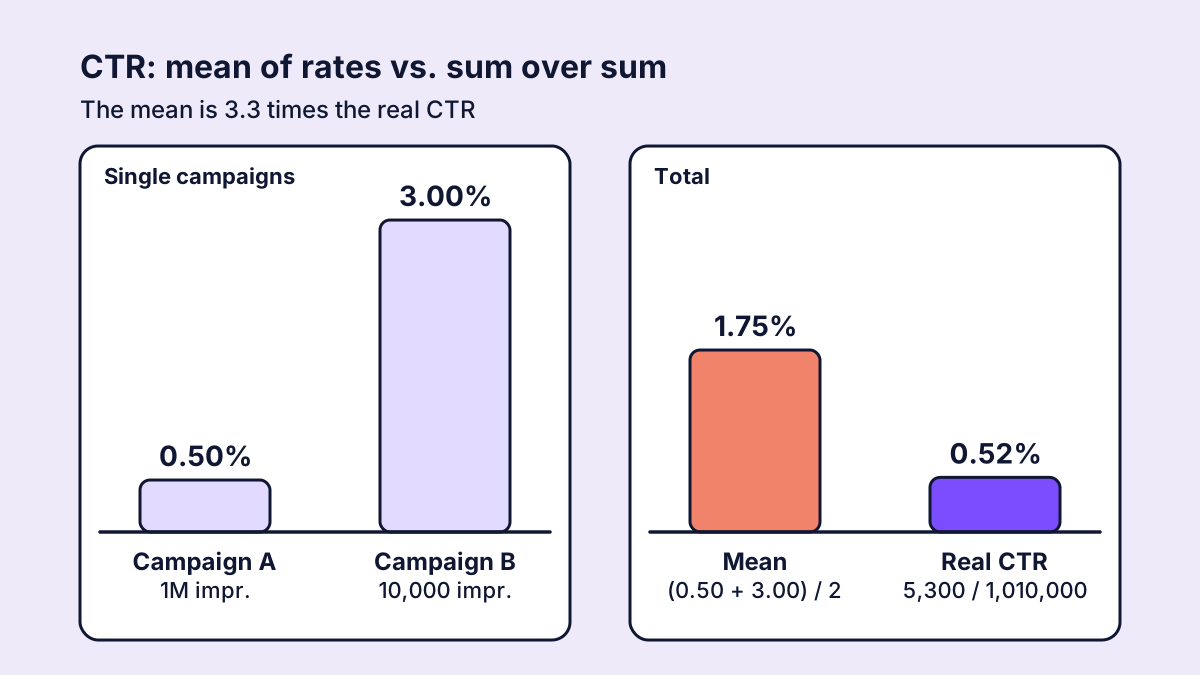
Figure 1: The mean of the individual CTRs against the real CTR from summed clicks and impressions.
The correct calculation is always the same: sum numerator and denominator separately, then divide.
CTR = Σ clicks / Σ impressions × 100
CPC = Σ spend / Σ clicks
CPM = Σ spend / Σ impressions × 1000
Engagement rate = Σ engagements / Σ impressions × 100
What matters is which denominator belongs to which metric. CPC is weighted by clicks, not by impressions. Frequency is impressions over reach, but reach cannot be summed across days or campaigns, because the same people would be counted again. And when a platform reports engagement for only part of its impressions, only that part belongs in the denominator of the engagement rate. Otherwise the rest dilutes the rate artificially.
The same applies over time. The mean of 30 daily CTRs gives a quiet Sunday with little delivery the same weight as the strongest day of the month. The monthly CTR is the month's clicks over the month's impressions, not the average of the days.
Every segment better, the whole worse
Even correctly weighted totals can mislead when the mix shifts. A worked example with two audiences, where existing customers click better than new prospects:
| Impressions month 1 | CTR month 1 | Impressions month 2 | CTR month 2 | |
|---|---|---|---|---|
| Existing customers | 100,000 | 2.0% | 40,000 | 2.2% |
| New prospects | 100,000 | 0.5% | 260,000 | 0.6% |
| Total | 200,000 | 1.25% | 300,000 | 0.81% |
Both audiences improved: from 2.0% to 2.2% and from 0.5% to 0.6%. Yet the total CTR drops from 1.25% to 0.81% (2,440 clicks on 300,000 impressions instead of 2,500 on 200,000). In month 2 the budget moved towards prospecting, the segment that clicks less to begin with.
Statisticians call this Simpson's paradox. In the meeting it sounds like: "CTR has collapsed, what is wrong with the creatives?" Only the mix changed.
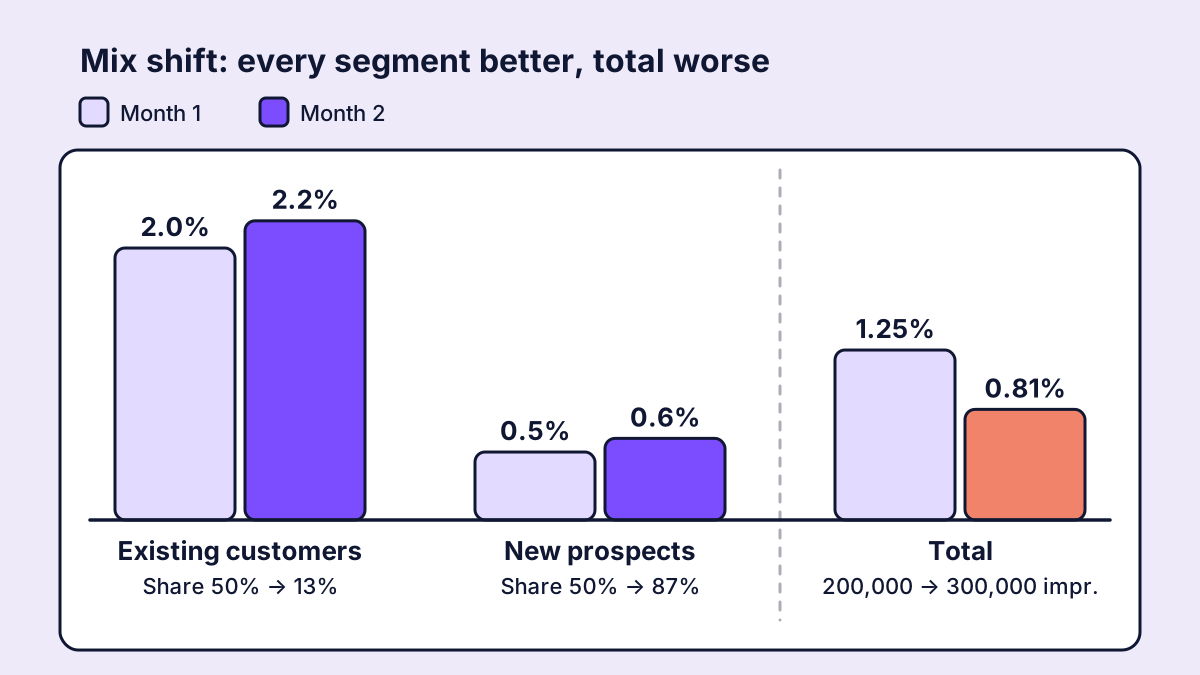
Figure 2: Mix shift. Every segment gets better, the total gets worse.
What helps:
- Never read a total without the segments underneath it, especially after budget shifts.
- When comparing over time, ask: did the rate change, or the distribution of spend and impressions?
- Set targets per segment when segments perform structurally differently (audience, platform, placement, objective).
1.5 or 0.015: percent and ratio
An inconspicuous mistake: a CTR of 1.5% can be stored as 1.5 (a percentage) or as 0.015 (a ratio). Both are fine as long as everyone knows which convention applies. The platforms do not agree. The Meta and TikTok APIs return CTR as a percentage, the Google Ads API as a ratio.
Put both into one table and you are off by a factor of 100. A YouTube CTR then shows as 0.009% instead of 0.9%, or a Meta CTR gets multiplied by 100 again and appears as 150% in the report. The second case gets noticed, the first slips through easily.
The rule: normalise to one convention at ingest, and wherever a rate is displayed, know which source it came from. While building sugarLENS we ran into exactly these factor-100 errors ourselves.
Small numbers, big outliers
That leaves rankings. Say one asset has 20 impressions and 1 click. CTR: 5.0%. Another has 20,000 impressions and 300 clicks. CTR: 1.5%. Sorted by rate, the first asset wins clearly.
But for the first asset, one more click would have doubled the CTR to 10%, one fewer would have made it 0%. For the second, an extra click moves the CTR from 1.500% to 1.505%. One is a fluke, the other a reliable signal.
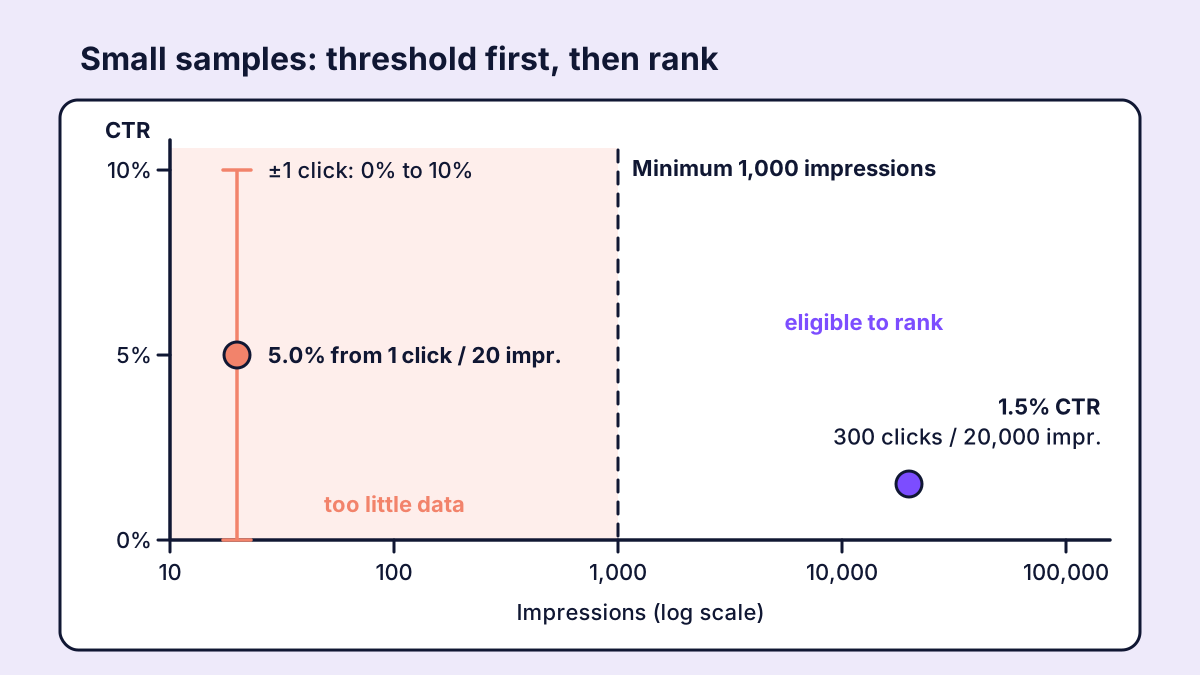
Figure 3: Minimum threshold first, ranking second.
That is why every ranking needs minimum thresholds: a minimum spend, a minimum number of impressions, and for CPC or CPO also a minimum number of clicks or purchases. The order is what counts. First filter down to the eligible assets, then pull the top 10 and the bottom 10. Fetch the ten worst first and filter afterwards, and large accounts can leave an empty list, because the worst values usually come from assets with barely any delivery.
How sugarLENS calculates
In the sugarLENS overview, rates come from summed base values: CTR from clicks and impressions, CPC from spend and clicks, and engagement rate only over the impressions that carry engagement data. Where a stored daily rate feeds in, as with CPM, it is weighted by impressions, never simply averaged. The total row across all platforms comes from the same calculation as the KPI cards, instead of re-weighting platform rates after the fact. Percentages and ratios are brought to one convention at ingest.
The top and bottom creative lists apply minimum spend and delivery thresholds (impressions, or reach for branding), and they apply before the cut to ten. That way the analysis of the best and weakest videos gets assets with enough data behind them, not the ones with the most luck.
FAQ
Is a simple average of rates ever correct?
Only when every row has the same denominator, for example exactly the same number of impressions. In practice that almost never happens, so sum over sum is safer.
How do I spot a mix shift?
When the total moves but the segments underneath stay stable or move the other way. Then look at how spend and impressions are distributed between the segments.
What minimum threshold makes sense?
It depends on the metric: the rarer the event, the more volume it needs. A CPO based on purchases needs more than a CTR. What matters is setting the threshold before you rank.
Why does my total CTR differ from the one in Ads Manager?
Common causes are averaged instead of summed rates, different click definitions (link clicks or all clicks) and a mix of percentage and ratio values. Comparing the base values, clicks and impressions, usually clears it up.