Creative performance is more than a look at the Ads Manager
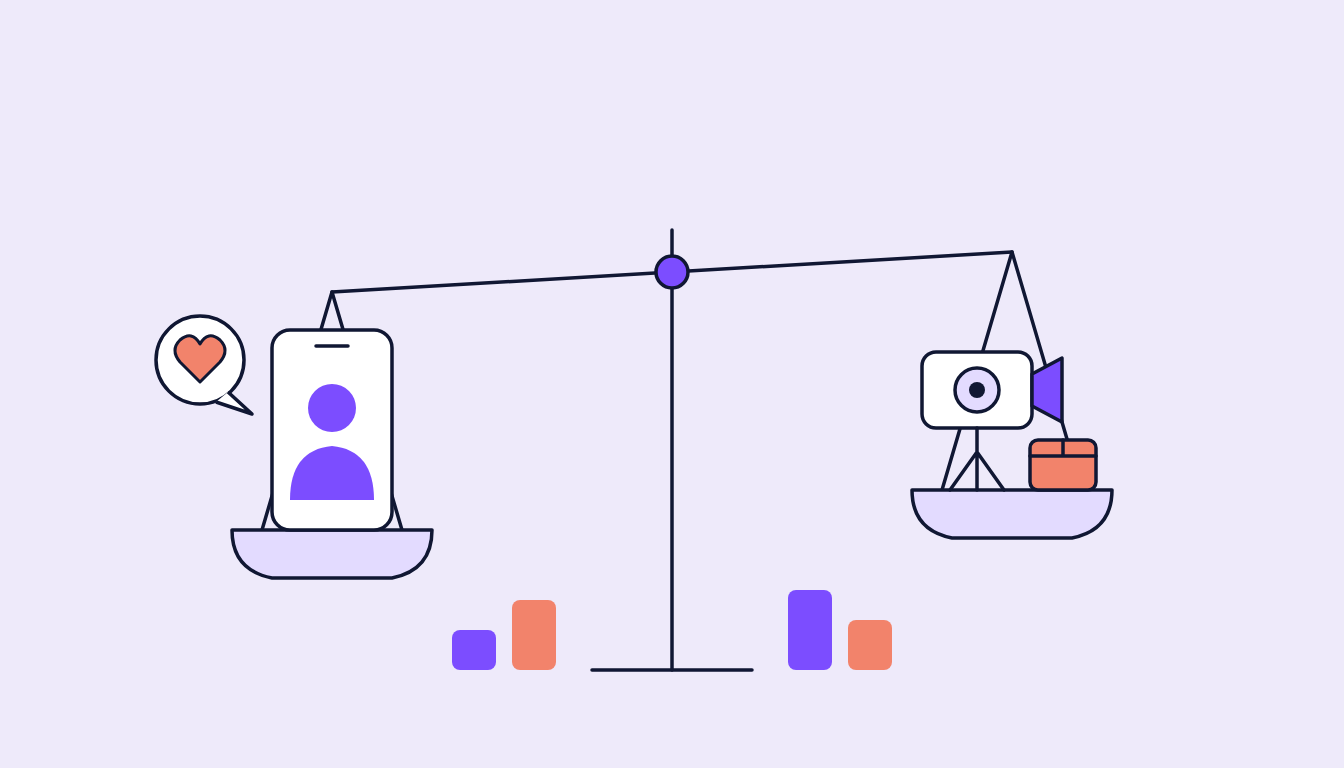
How well does a creative concept perform on social media? The quick answer often lies in three letters: CPM, CPC or CPA. Sure, the numbers are important. But they don't tell the whole story.
At JUSTADDSUGAR, we don't just look at the usual media KPIs in Ads Manager. We look at performance across all teams, from Strategy & Consulting through Concept & Creation to Creator & Community Management.
Because in the end, we don't just want to know whether an ad was delivered cheaply. We want to know: Does the idea land? Do people stick around? Is the message understood? Is the content liked, commented on, shared or saved? Does the creative fit the brand? And does it move people further down the funnel?
A low CPM is nice at first. But it doesn't tell you whether a creative is actually any good. A high CTR sounds good, but it doesn't show whether the right people are clicking, whether the landing page works, or whether a conversion happens in the end.
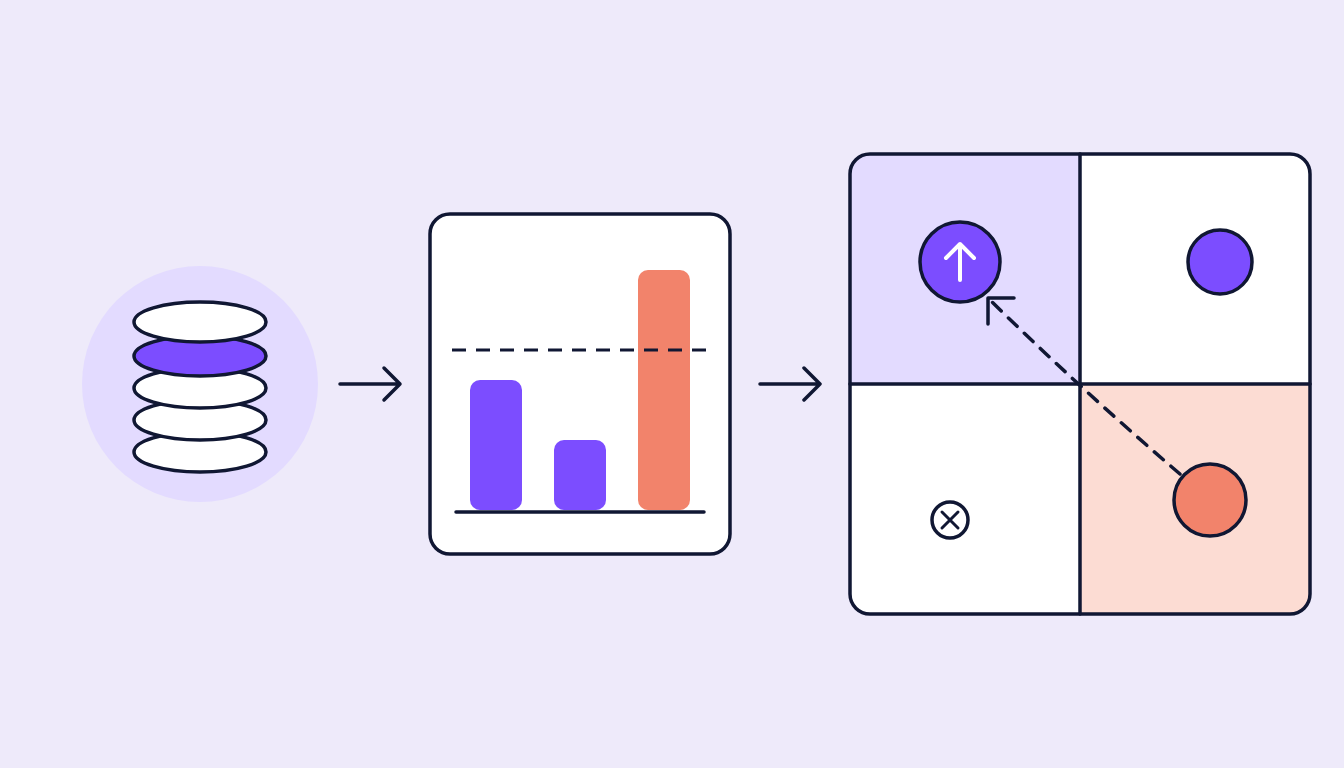
This is exactly where our sweet spot lies: we combine numbers with what our teams from creation, media, creators and community see. This lets us find out not only which creative wins, but also why it wins. And most importantly: what we can do even better with the next asset.
The right KPI depends on the job of the asset
Not every creative has the same job. A brand video is meant to generate attention and awareness. A creator asset can build trust. A link ad is meant to drive traffic. A performance ad, ideally, is meant to sell.
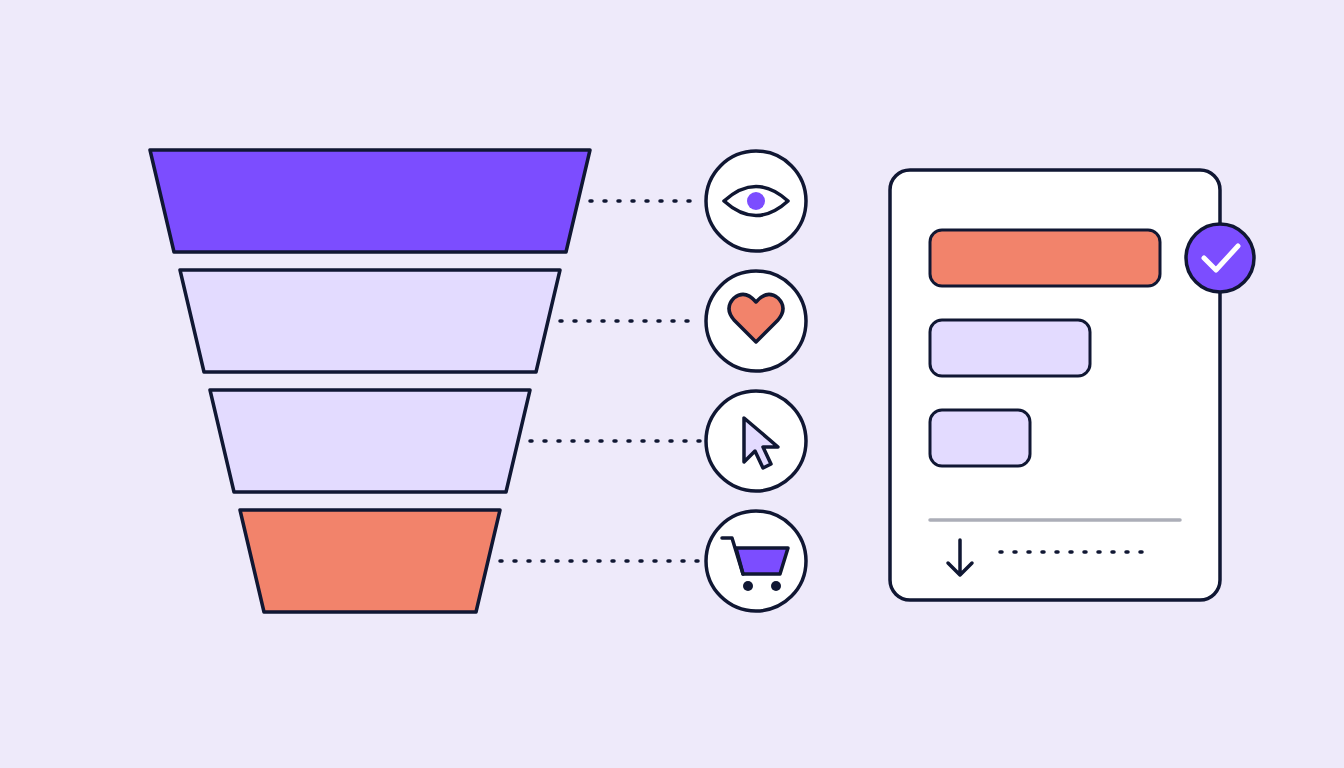
That's why a KPI isn't simply good or bad. It has to fit the goal. In the awareness phase, we tend to look at reach, impressions, frequency, watch time or completed views. In the consideration phase, engagement, shares, saves, CTR and CPC become more relevant. In the action phase, CPA, ROAS and actual conversions are what count.
Or in short: first clarify the job, then pick the right KPI.
1. Visibility and delivery: Reach, impressions and frequency
Before a creative can have an impact, it first needs to be seen. That's exactly what this section is about: How many people do we reach, how often is the asset delivered, and what does visibility cost us?
Reach: How many people see the creative?
Reach is the number of users who come into contact with a creative. Especially for awareness campaigns, this is the first important check: Is the message actually reaching enough people?
We don't just look at reach at the campaign level, but also compare individual assets, target groups, platforms, placements and time periods. This reveals which creative reaches new people and which mainly lands with the same audience again and again.
Reach alone is not a seal of quality. It shows that people were reached, not automatically that they understood the message or remembered the brand. For that, we need other signals such as impressions, frequency, video views or engagement.
Impressions: How many contacts are made?
Impressions count every ad contact. One person can therefore generate multiple impressions, whereas they are only counted once for reach.
This number helps us understand how often a creative was actually delivered. Repetition can be a good thing if a message first needs to sink in. Too many contacts with the same asset, however, can get annoying. The key term here is: ad fatigue.
That's why we always look at impressions together with reach and frequency. The crucial question isn't just: How many contacts were there? But also: How are they distributed?
Frequency: How often does a person see the ad?
The Frequency is calculated as follows:
Impressions / Reach
It shows how often a person has seen a creative on average. A low frequency can create too little recognition. A very high frequency, on the other hand, can mean the ad is slowly wearing out.
Frequency becomes particularly interesting when comparing creatives: Does a particular concept need several contacts before the message sticks? Or does the idea work from the very first scroll stop?
For this, we place frequency alongside, among other things:
- the development of reach,
- engagement rate and CTR,
- CPM, CPC and CPA,
- watch time and skip behavior,
- the development over the campaign period.
CPM: What does visibility cost?
The Cost per Mille, or CPM for short, shows the cost of 1,000 impressions:
Cost / Impressions * 1000
A low CPM can mean that the platform accepts the creative well and delivers it cheaply. A high CPM can indicate a less relevant message, little interaction, a small or highly competitive target audience, or simply a more expensive channel.
Important: A low CPM doesn't automatically make a creative good. Being delivered cheaply is a long way from the content actually sticking. That's why we combine CPM with reach, engagement, watch time, CTR or conversions.
CPM values also cannot be blindly compared across platforms. Target audience, placement, campaign objective and competition always play a part.
Audience Saturation: How saturated is the target audience already?
Audience Saturation shows what share of the potential target audience has already been reached. The Creative Glossary defines this metric as follows:
Reach / potential reach
If the metric is to be shown as a percentage, the result is multiplied by 100.
As saturation increases, reach often stagnates while frequency rises. At the same time, CPM and other costs can increase. This doesn't necessarily mean the creative idea is bad. Perhaps the audience is simply too small, too niche, or already saturated with the same asset.
For us, this is an important distinction: Is the creative weak, or is the target audience simply saturated? Only when we separate the two can we optimize properly.
2. Video views and attention: Watch Time, CPV and Completion Rate
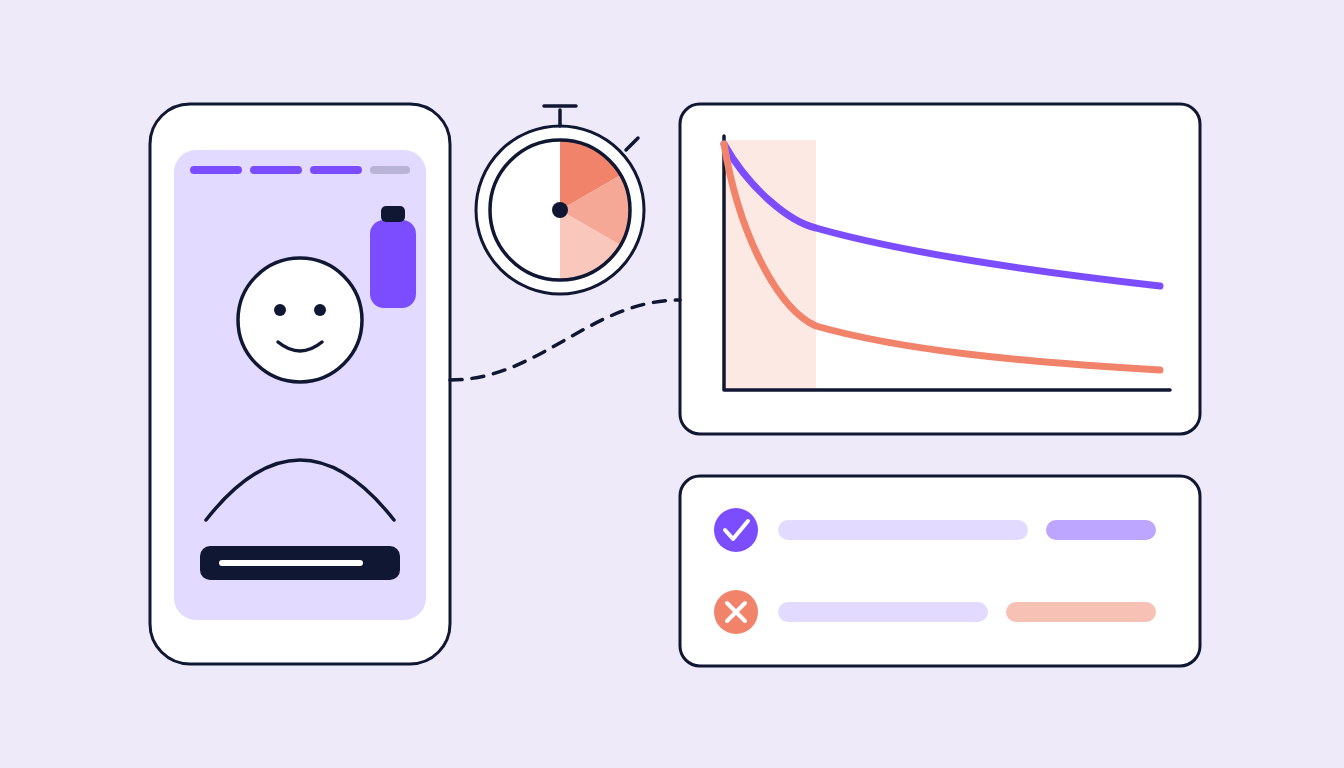
With video content, it's not enough for the video to simply play. The interesting question is: Do people stay tuned? And do they get to the message the creative is building up to?
Average Watch Time: How long do people keep watching?
The Average Watch Time, or AWT for short, shows the average viewing time:
Time of all views / Number of views
The longer the watch time, the longer the actual contact with the brand. This can be a good sign that hook, visual language, story and message are working.
We compare AWT, for example, across different hooks, video lengths, target audiences, platforms and placements. The development over the campaign period is also interesting: Does the creative become better understood over time, or does it slowly lose its magic?
Watch time becomes particularly meaningful in combination with CPV, Completed View Rate, CTR or Cost per Message Received.
Cost per View: What does a view cost?
The Cost per View, or CPV for short, is calculated as follows:
Cost / View
The KPI shows how much a view costs on average. A low CPV sounds good at first. But here too: a cheap view is not automatically a good view.
Because not all views are created equal. Each platform defines views slightly differently. Therefore, view duration and counting method must be checked properly before making a comparison. Otherwise, a CPV comparison between Meta, TikTok and YouTube quickly becomes apples and oranges.
Together with the Average Watch Time, the CPV shows whether we are only buying cheap short contacts or actually building valuable attention.
Completed View Rate: Do people watch until the end?
The Completed View Rate, also VTR 100%, shows the share of complete video views out of all impressions:
100% Views / Impressions
A high completion rate can mean that hook, storyline, length and resolution work well together. A low rate doesn't automatically mean the whole idea fails. Perhaps the hook is too weak. Perhaps the core message comes too late. Perhaps the length doesn't suit the platform.
That's why we take a closer look:
- Where do people drop off?
- Does the message arrive early enough?
- Does the dramaturgy work until the end?
- Does one target group watch longer than another?
- Does the completion rate also lead to engagement or clicks?
Cost per Message Received and Cost per Groschenmoment
With Cost per Message Received, or CPMR for short, we look at what a view costs that makes it all the way to the core message:
Cost / Views until Message Received
The Cost per Groschenmoment, or CPGromo for short, starts exactly at the penny-drop moment where the core message lands:
Cost / Views until the Groschenmoment
Both metrics are particularly helpful when a video builds something up before the actual message arrives. A high value can mean that many users drop off beforehand. The possible reasons are often quite obvious: a weak hook, an overly complicated message, a build-up that takes too long, an unclear story, or an unsuitable target audience.
This is how a media KPI becomes a concrete creative learning: Do people get to the moment we built the whole video for?
3. Engagement: Does the content land with people?
Views are nice. Reactions are more interesting. Engagement shows that a piece of content didn't just pass through the feed, but actually stuck somewhere.
Engagement Rate: How relevant is the creative?
The Engagement Rate, or ER for short, is calculated as follows in the Creative Glossary:
(Reactions + Shares + Comments) / Impressions
It relates reactions, shares and comments to impressions. This lets us see how often a contact actually led to an interaction.
We look not only at the level of the rate, but also at the mix behind it:
- Many reactions can speak for a clear and relatable message.
- Comments show that a topic gives people something to talk about. This can be agreement, questions or disagreement.
- Shares are a strong relevance signal and bring additional organic impressions.
- Saves show that the content can still be useful, inspiring or interesting later on.
Important: Engagement Rate is not read the same way on every platform. The Creative Glossary states that the metric should not be used for YouTube, and not with saves on TikTok. Platform and definition therefore always belong in the reporting.
Share Rate: Would I forward this?
The Share Rate shows what proportion of all engagements are shares:
Shares / Engagement
A share is the digital pat on the back for a creative. People share content when it entertains them, informs them, moves them emotionally, or gives them a reason to say, "You have to see this."
A high share rate can therefore show that a creative concept delivers more than just an advertising message. It has social or content-related added value. For the evaluation, we still look at the context: What is being shared, and does it pay off for the brand?
Save Rate: Do people come back to the content later?
The Save Rate is calculated as follows:
Saves / Engagement
A save says: I want to look at this again later. This is a particularly valuable signal for how-to content, tips, inspiration, recipes, guides and product information.
A high save rate therefore shows that an asset not only works in the moment, but has real content value.
Reaction Rate: Does the creative trigger something spontaneously?
The Reaction Rate describes what proportion of all engagements are reactions:
Reactions / Engagement
Reactions are the low-threshold form of engagement. A like, a heart or another reaction happens quickly. A high reaction rate can therefore indicate a clear, easily digestible and relatable message.
Not every creative needs to generate the same kind of engagement, though. An emotional brand video might collect many reactions. A helpful service post is more likely to be saved or shared. What counts as good depends on the creative objective.
4. Clicks and traffic: CTR and CPC
If the creative is meant to lead to the website, the shop or a landing page, CTR and CPC come into play.
Click-Through Rate: Does the ad get people to click?
The Click-Through Rate, or CTR for short, is calculated as follows:
Clicks / Impressions
It shows how many impressions led to a click on the CTA. This gives us a good indication of whether creative, message and call to action make people want to take the next step.
For the creative analysis, we look at:
- Motif and creative,
- Hook and central message,
- Copy and CTA,
- Target group,
- Platform and placement,
- Frequency and campaign phase.
A CTR is never read completely in isolation. A creative can have a high CTR and still be expensive because of a high CPM. Conversely, a moderate CTR can work very well with efficient delivery.
And one more important point: A click is not yet a conversion. The quality of the traffic only shows on the landing page and further down the funnel.
Cost per Click: What does a link click cost?
The Cost per Click, or CPC for short, describes the cost of a link click:
Cost / Click
If the CPC rises, this can be due to a weak hook, an unclear message, an unconvincing CTA, too high a frequency, or an unsuitable audience.
CPC is particularly well suited for creative tests when the conditions are comparable: same ad set, same target audience, same placement, same optimization goal. Otherwise, we end up testing not just the creatives, but five other variables as well.
5. Conversions and sales: CPA and CPO
A click is a good start. But when it comes to leads, purchases or other actions, we naturally want to know what happens next.
Cost per Action: What does a desired action cost?
The Cost per Action, or CPA for short, is calculated as follows:
Cost / Action
An action can be, for example, a lead, an add-to-cart, a registration or a purchase. The CPA shows how much budget was needed for this action.
In creative analysis, the CPA helps us understand whether an asset not only generates attention but also moves people through the funnel. A high CTR with a weak CPA can mean: the ad sparks curiosity but doesn't set the right expectations or bring the right traffic.
Fewer clicks can actually be better if they result in more qualified conversions. That's exactly why we look not only at volume, but also at quality.
Cost per Order: What does a purchase cost?
The Cost per Order, or CPO for short, describes the cost of a purchase:
Cost / Order
For e-commerce and sales campaigns, the CPO is a key KPI. It shows whether a creative generates orders efficiently.
For the full story, however, a few more things belong in the picture: average basket value, product category, new or existing customer, returns, customer lifetime value, revenue and profitability.
A low CPO is therefore a strong signal, but not automatically the end of the analysis. A creative can sell well in the short term and still have little brand impact or hardly any reuse potential. That, too, is part of creative performance.
6. Creator Performance: Assessing creator content properly
Creator content works differently from a classic brand asset. A personal tone, credibility and a native platform look are often the sweet spot. That's why creator content shouldn't be judged on views or likes alone.
Cost per Creator: What does a creator impression cost?
The Cost per Creator relates creator costs to organic and paid impressions:
Creator Cost / (organic + paid Impressions) * 1000
The metric shows what 1,000 impressions with creator content cost. This makes creator assets and campaigns easier to compare with each other.
But here too: costs alone don't make a winner. A creator might deliver fewer impressions but generate a particularly strong watch time, engagement rate, share rate, save rate, positive comments or conversions.
For creator performance, we therefore look at, among other things:
- Does the creator fit the target audience and the brand?
- Does the message sound like the creator or like an ad read off a script?
- Does the asset work organically and as a paid ad?
- How long do people stay in the video?
- Is the content shared, saved or commented on?
- Are qualified clicks and conversions generated?
Creator content across the full funnel
Creator content can work across the entire funnel. In awareness, it's about reach and attention. In consideration, reviews, tutorials and comparisons help. In action, product demos, social proof and a clear CTA can give the final push.
The choice of KPIs therefore depends on the job of the asset. For awareness, reach, CPV, watch time and shares are interesting. For conversion creatives, CTR, CPC, CPA and CPO move to the front.
7. In-house content: What does your own production deliver?
Cost per Inhouse: What does an impression with your own content cost?
Cost per Inhouse relates in-house costs to organic and paid impressions:
Inhouse Cost / (organic + paid Impressions) * 1000
This lets us compare what 1,000 impressions with our own JAS content cost. The metric is particularly interesting when we plan production volume, format development and content recycling.
But cost per impression isn't the whole calculation. An in-house asset can be particularly valuable if it works across multiple platforms, in many formats and over a longer period. A more elaborate asset can also be worthwhile if it delivers strong attention, brand impact or conversions.
That's why, in addition to production costs, we also look at media performance, usage duration, adaptability and the learnings for upcoming creatives.
8. Brand love and community: Sentiment Score and Time Spent with Brand
Performance doesn't end with the click. Especially on social, a lot of it sits in the comments and in the time people actually spend with a brand.
Sentiment Score: How is the message received?
The Sentiment Score shows the mood in the comments. The Creative Glossary defines the KPI as follows:
(positive comments + neutral comments - negative comments) / all comments
This lets us see not only whether people comment, but also how they talk about the brand or the topic. A creative can collect many comments and still trigger mostly negative reactions. Many interactions are therefore not automatically good interactions.
For the evaluation, the content of the comments counts alongside the score:
- Which topics keep coming up?
- Where are there questions or misunderstandings?
- What is the community celebrating?
- Where is the product or brand being criticized?
- Are there any signs of reputational or crisis issues?
This is exactly where community management delivers important learnings for copy, concept, content and brand voice.
Time Spent with Brand: How much time does the brand get?
Time Spent with Brand is listed in the Creative Glossary as an awareness metric. It is meant to show how much time people spend with brand-related content.
The exact calculation can vary depending on platform, tracking setup and definition. Before reporting, it therefore has to be clear which views, impressions and watch time values are included. Otherwise, the comparison quickly goes off track.
The KPI is particularly interesting when it's not just the number of contacts that counts, but the quality of the attention. For that, we place it alongside reach, impressions, Average Watch Time, Completed View Rate and the respective costs.
Why a single KPI never tells the whole story
A creative performance analysis only becomes really interesting when several signals interact. A few typical cases:
High reach, low watch time
The creative gets delivered, but attention is gone again quickly. Perhaps the hook is too tame, the opening too slow, or the message comes too late.
Low CPM, low engagement rate
The ad runs cheaply but doesn't trigger much. This could be due to a message with little relevance. But it's also possible that engagement wasn't the campaign's goal at all. Context first.
High CTR, weak CPA or CPO
The ad brings clicks, but no good conversions. Perhaps the ad promises something different from the landing page. Perhaps the traffic isn't qualified. Or the CTA sparks curiosity without really convincing.
High engagement rate, negative sentiment
The creative generates plenty of discussion, but not necessarily brand love. That's why comments and sentiment always belong on the table together.
High completion rate, low CTR
People watch the video to the end but don't go any further afterwards. Then it's worth taking a look at the CTA, the offer, the message and the transition to the landing page.
Good paid performance, weak organic resonance
An asset can run strongly as a paid ad and resonate less organically. That's no contradiction. Paid media, audience and context work differently. We look at both perspectives separately and then bring them back together.
This is how we build a Creative Measurement Framework
For KPIs to do more than look nice in a report and actually enable real decisions, a clear setup is needed.
1. Clarify the job of the creative
Before launch, it must be clear what the asset is supposed to achieve: awareness, reach, attention, engagement, traffic, leads, sales, or something else entirely.
2. Define a primary KPI
Not every number needs to shout equally loud. The primary KPI shows whether the campaign goal is being achieved. Secondary KPIs help us understand why the result looks the way it does.
For a video, for example, the Completed View Rate might be the focus. Average Watch Time, CPV and Cost per Message Received then provide the explanation behind it.
3. Create fair conditions
Creatives can only be compared meaningfully if the most important conditions are similar:
- Platform,
- Placement,
- Target group,
- Campaign goal,
- Budget and duration,
- Format and length,
- Optimization goal,
- View and engagement definition.
Otherwise, we're not only testing the idea, but half the setup as well.
4. Connect numbers with real reactions
KPIs show what's happening. Qualitative signals show why. That's why comments, community feedback, creator insights, ad reviews and learnings from Concept & Creation belong in the analysis.
5. Record learnings
Good reporting doesn't end with "Creative B had the better CTR." It ends with a statement the team can work with.
For example:
- The message lands better if it appears in the first few seconds.
- Creator formats generate more shares, in-house assets contribute more to the CTA.
- One target group watches longer, but needs a different product presentation.
- An emotional opening boosts engagement, a functional opening improves the CPC.
- As frequency rises, the creative loses attention and needs a new version.
Creative Testing: Turning numbers into better assets
Creative testing is more than "Ad A versus Ad B". We test individual levers and learn from them what works for the brand and the target audience.
What can be put to the test:
- Hook,
- Visual,
- Storyline,
- Speaker or creator,
- Product focus,
- Amount of text,
- CTA,
- Music and sound design,
- Length,
- Format,
- Social proof,
- Benefit argument,
- Tone of voice.
The KPI has to match the variable. When we test the hook, we look at early view signals, Average Watch Time and Cost per Message Received. When we test the CTA, CTR, CPC, CPA or CPO become more important. When it comes to brand impact, reach, frequency, Time Spent with Brand, engagement and sentiment move to the front.
This way, reporting doesn't become a graveyard of numbers, but an ongoing creative learning process.
FAQ about creative performance KPIs
What is the most important KPI for creative performance on social media?
There isn't one single most important KPI. The job of the creative decides. For awareness, reach, impressions, frequency, CPM, Average Watch Time and Completed View Rate can be relevant. For consideration, engagement rate, CTR and CPC become more interesting. For action, CPA and CPO count.
How do you measure whether a creative concept works?
By bringing together media KPIs, qualitative signals and the campaign goal. Depending on the use case, we look at reach, attention, engagement, clicks, conversions, creator performance, sentiment and brand impact.
What is a good engagement rate?
There is no universally valid benchmark. Platform, format, target audience, industry, campaign objective and calculation method all make a difference. That's why we look at comparable setups and the development over time.
Why isn't a high CTR enough?
A high CTR shows that people are clicking. But it doesn't tell us whether the clicks are qualified, the landing page works, a conversion happens, or the message fits the brand. For that, we need CPC, CPA, CPO and a look at the rest of the funnel.
How do you evaluate creator content?
With a mix of costs, reach, attention, engagement, shares, saves, sentiment and conversions. Cost per Creator shows the cost per 1,000 impressions, but on its own says nothing about the quality of the contact.
What is the difference between reach and impressions?
Reach describes the number of users reached. Impressions count all ad contacts. One person can therefore generate multiple impressions, but is only counted once for reach.
Which video KPIs are relevant on social media?
The most important video marketing KPIs include Average Watch Time, CPV, Completed View Rate (or VTR 100%), Cost per Message Received and Cost per Groschenmoment. Important: Views are defined differently across platforms.
Conclusion: Data in, better creatives out
Successful creative concepts don't come from a single number. They come from the idea, the message, the format, the platform, the target audience and the right delivery. Everything is connected.
At JUSTADDSUGAR, we therefore look beyond the usual media KPIs. Strategy, creation, production, post, paid, creators, community and reporting each bring a different perspective. Only together do they form a picture of what a creative really achieves.
We don't just want to know which asset wins. We want to know why it wins and how we can transfer this learning to the next creative.
Because that's exactly what creative performance is about: not collecting as many numbers as possible, but making the right decisions for better social media creatives.
At JUSTADDSUGAR, measuring creative performance means translating data into better ideas.
Editorial note
The KPI selection and definitions in this article are based on JUSTADDSUGAR's internal Creative Glossary. Views, engagements, impressions and conversions may be defined differently depending on the platform. Before each report, the definitions and comparison rules used should therefore be documented in the respective setup.