What competitors run is public. What it achieves is not.
Finding out which ads a competitor runs on Instagram or TikTok needs no spy tool. Meta and TikTok operate public ad libraries, and organic profiles are public anyway.
That is an opportunity, but also a trap. Only the surface is public: which creatives are live, since when, in which format. Whether they work, what they cost and exactly whom they target is written nowhere.
Good competitor analysis separates what you see from what you guess, and derives hypotheses for your own account instead of copying.
The three public sources
Meta Ad Library
The Meta Ad Library shows every active ad an advertiser runs on Facebook, Instagram and Meta's other platforms. You can search by brand or keyword and filter by country and platform. Each ad shows its start date, its placements and whether several versions share the creative.
For ads delivered in the EU, it also shows ended ads plus rough reach and targeting by age, gender and location. Spend is only shown for ads about political and social issues, and even then only as a range per ad.
TikTok Creative Center and Commercial Content Library
The Creative Center is mainly a source of inspiration: top ads by industry and objective, plus trends in hashtags, sounds and creators. The Commercial Content Library is the actual archive for ads running in the EU. It lists an advertiser's ads with the period they were shown and rough reach figures.
Organic profiles
Competitors' Instagram, TikTok or YouTube profiles show how often they post, which formats dominate, which topics recur and how the community responds. Likes, comments and views are public unless the account hides them. Comments often reveal more about perception than any metric.
What you can see and what you cannot
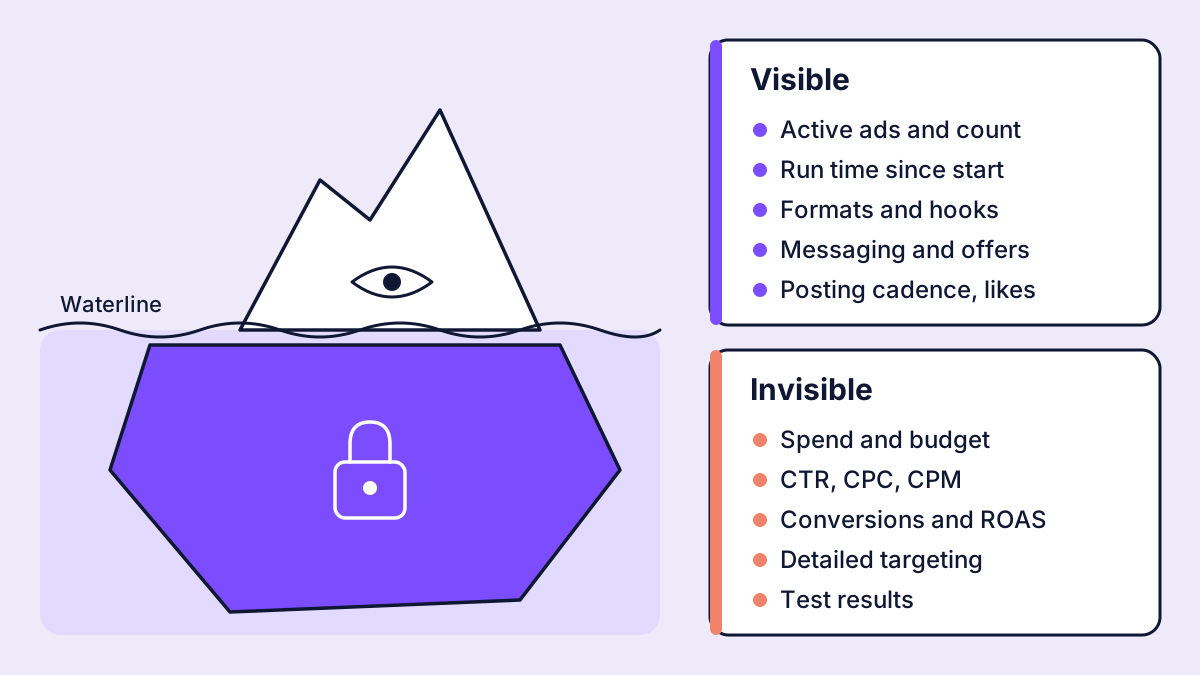
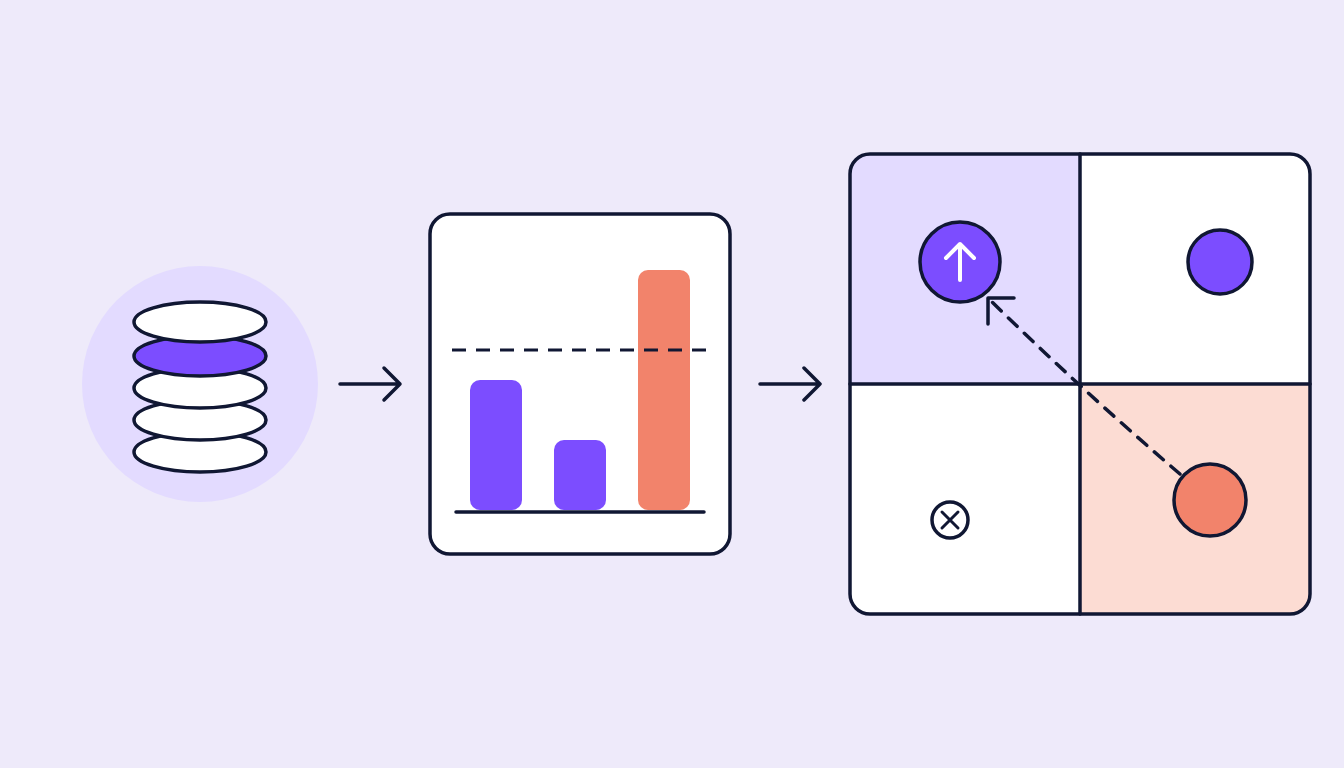
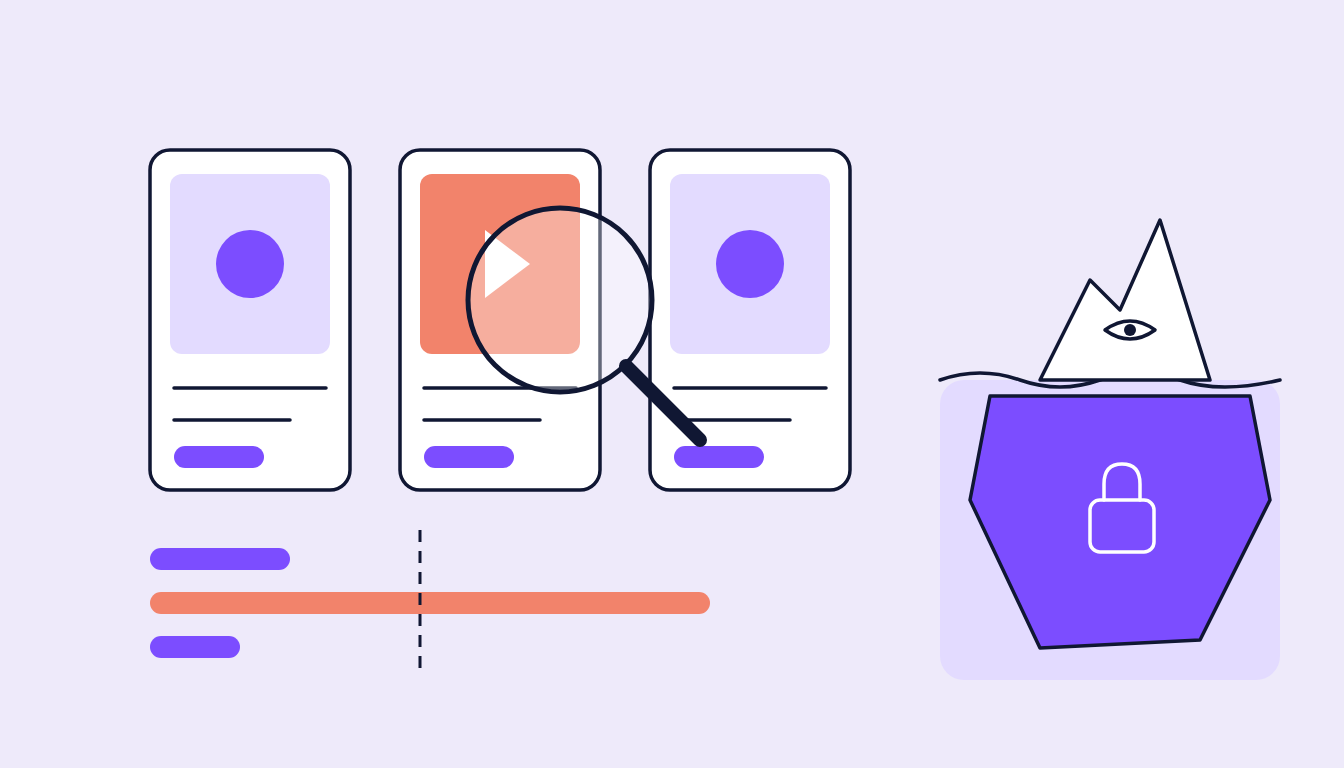
Figure 1: Public sources show the tip of the iceberg. The numbers that decide success sit below it.
Visible are mainly signals around the creative:
- which ads are currently active and how many run in parallel,
- how long an ad has been running (its run time),
- formats: video, static, carousel, creator content, vertical or square,
- hooks, meaning the first seconds and the first line of copy,
- messaging: benefit claims, offers, tone of voice, CTAs,
- on organic: posting cadence, topics and public engagement.
Invisible is everything that decides success:
- Spend: how much budget sits behind an ad,
- CTR, CPC and CPM: how efficiently it is delivered,
- Conversions and ROAS: whether it sells,
- Detailed targeting: interests, custom audiences, lookalikes, exclusions,
- Test results: which variant won internally and why.
In practice the two get mixed up constantly. 40 active ads do not mean a big budget. It could be a broad test on small amounts.
Run time: the best public signal there is
Without performance data, run time is the most useful proxy. Advertisers rarely keep paying for a useless ad for months. Ads gone after a week were likely tests; ads still active after three months have probably proven themselves.
Run time in days = last day of delivery - start date
A worked example: assume a competitor launched eight new ads in March. Six of them are gone again after 4-12 days. Two are still running in early June, one of them for more than 90 days: a creator video with a product test in the first two seconds.
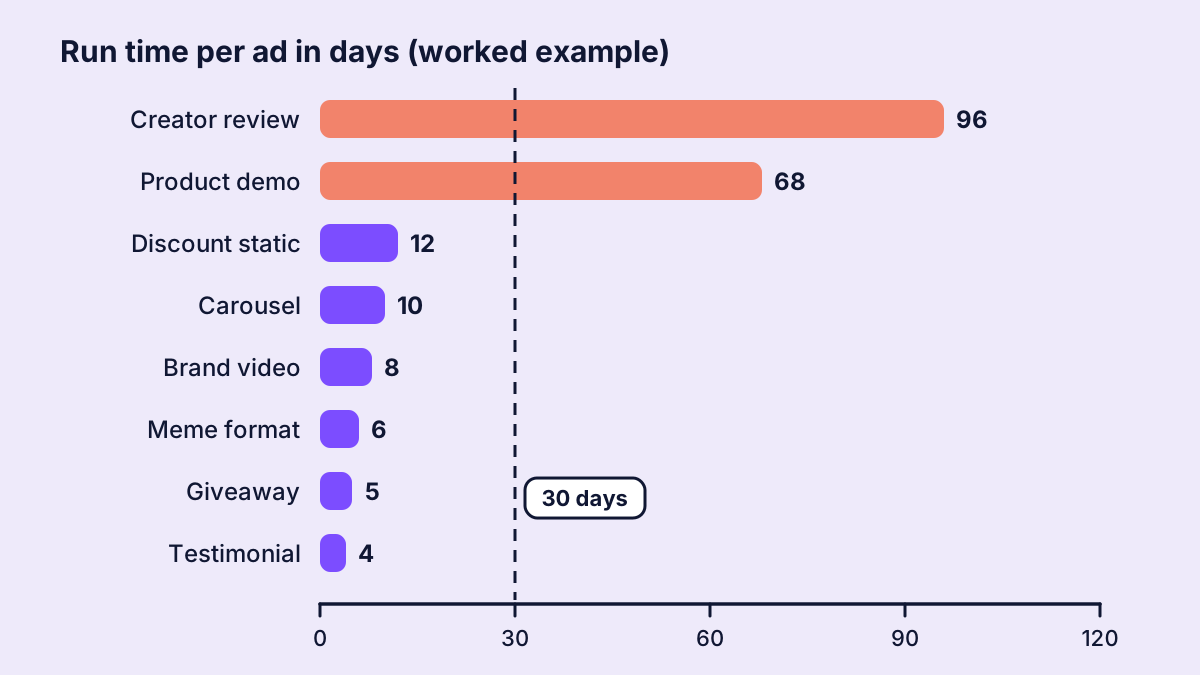
Figure 2: Worked example. Two of eight ads run longer than 30 days. Those are the ones worth a closer look.
The long-runners matter not because they are surely the best, but because the competitor keeps funding them. Still, run time is only a clue:
- Always-on campaigns run for a long time, however good the individual creative is.
- Forgotten ads happen at big brands too.
- Small budgets keep an ad alive without giving it much weight.
It gets reliable when clues stack: long run time, several versions of one concept, the same idea on organic.
A monthly routine in four steps
Looking once achieves little. Only months of comparison show what stays. One fixed slot per month is enough.
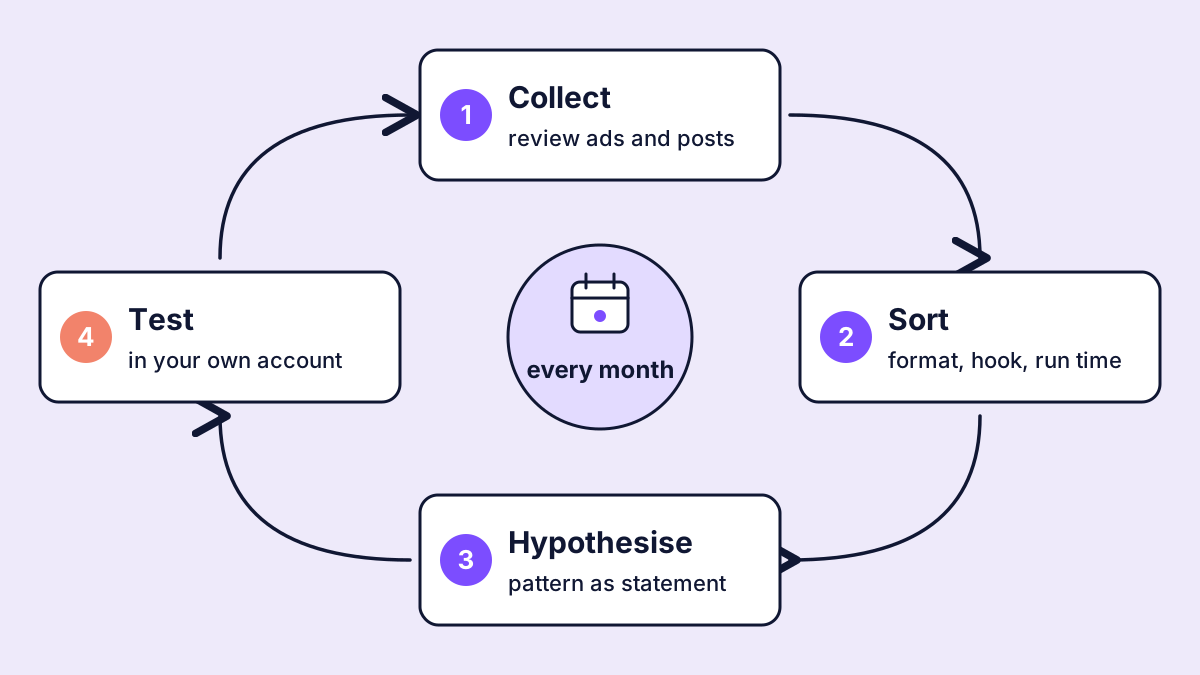
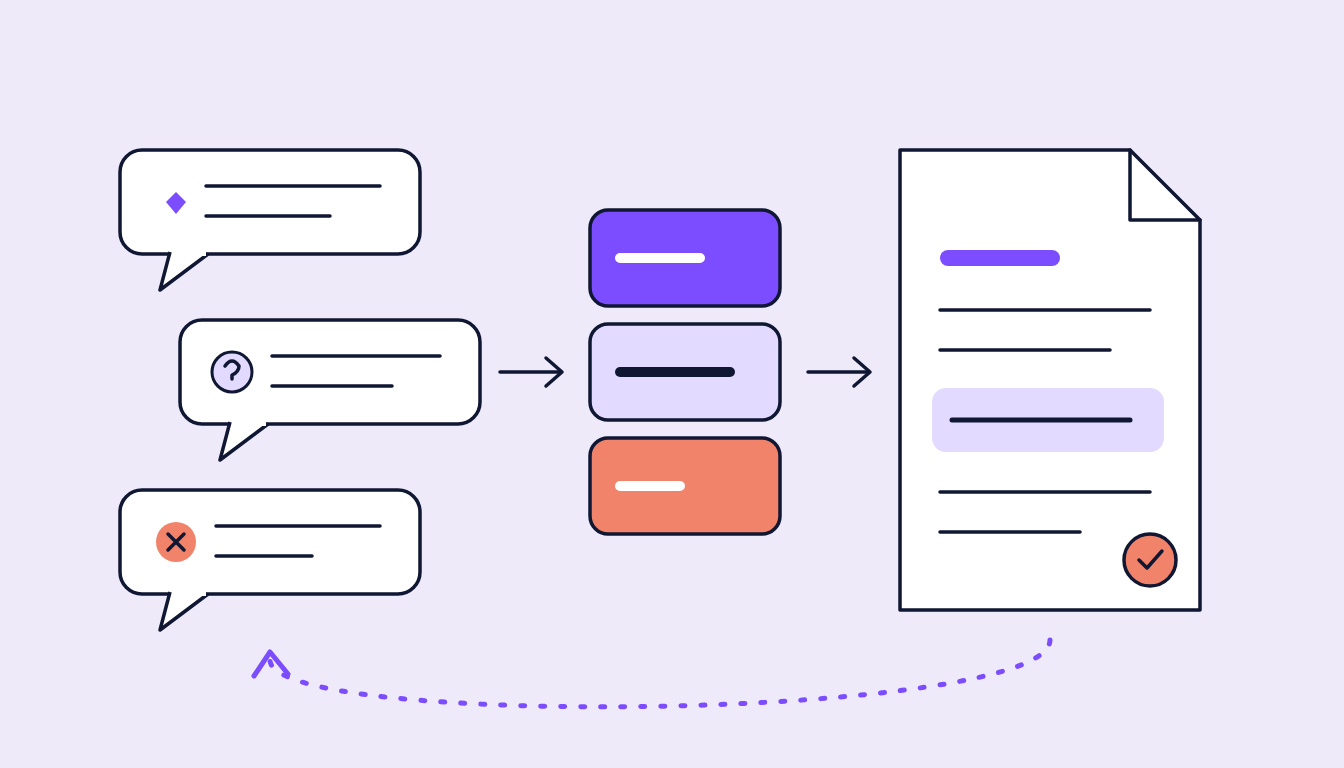
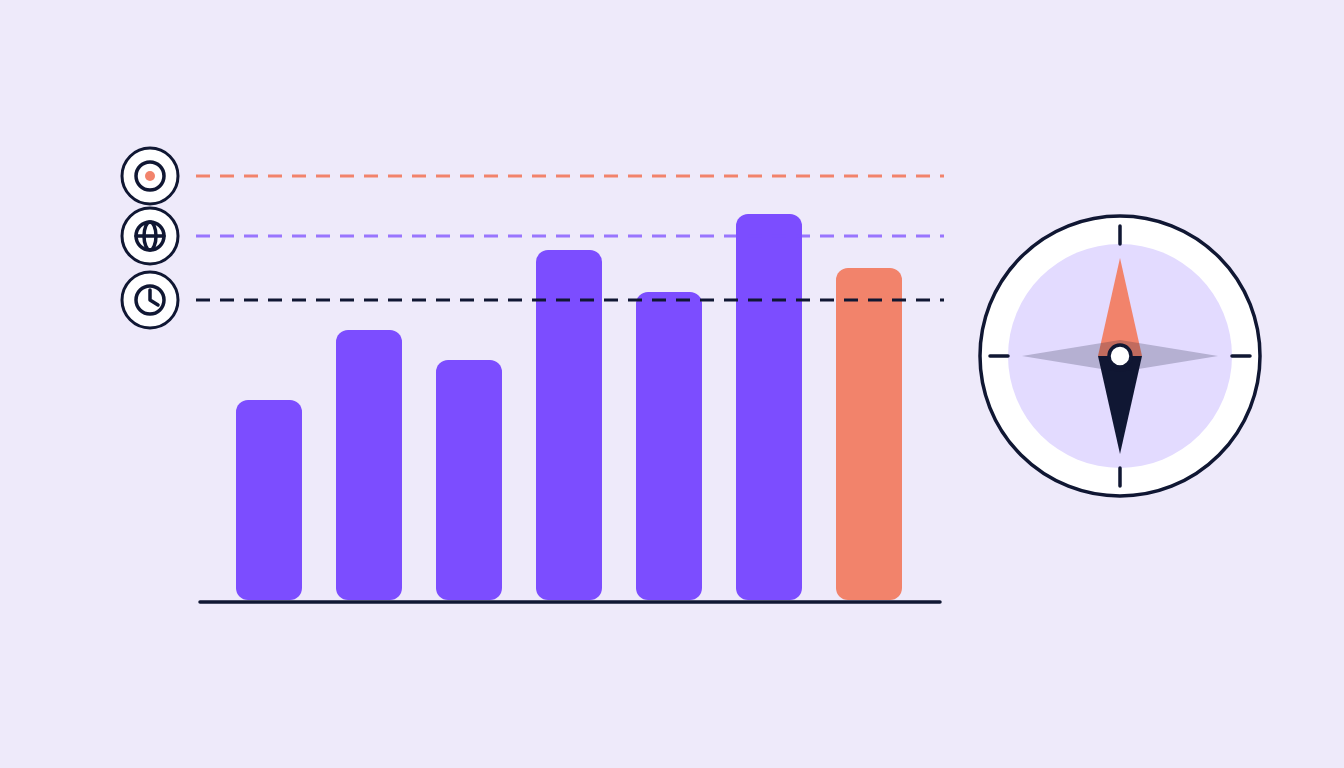
Figure 3: The monthly routine as a cycle. Test results feed into the next round.
- Collect: for a fixed set of three to six competitors, review the active ads and the month's posts. Always the same countries and platforms.
- Sort: tag every notable ad by format, hook, benefit claim, offer and run time. Flag long-runners, new concepts and concepts that disappeared.
- Form hypotheses: translate patterns into statements you can check in your own account.
- Test: bring one or two hypotheses per month into your own creative test and judge them on your own numbers.
Document it in one sheet: date, competitor, link, tags, run time. Within months it becomes a picture of the market.
From observation to hypothesis, not to a copy
The most common mistake: rebuilding a long-runner almost one to one. But audience, brand and offer differ, and a copy is always one step behind.
Better: abstract the idea behind it and phrase it as a testable statement, with an observation, an assumption and a fitting KPI.
| Observation at the competitor | Hypothesis for your own account | Fitting KPI |
|---|---|---|
| Creator video with a product test has run for over 90 days | A product test in the first two seconds holds attention longer than a brand intro | Average watch time, hook rate |
| Three new ads put the price up front | A clear price in the first frame lowers CPC compared with a pure benefit claim | CTR, CPC |
| Behind-the-scenes posts do well on organic | Behind-the-scenes as a paid creative lifts engagement in consideration | Engagement rate, shares |
Measurement happens only in your own account, because that is the only place where spend, CTR and conversions are visible. Competitor analysis supplies the questions, your own data the answers. And if the test shows the idea does not carry, that is a valid result too.
How sugarLENS handles it
For clients with the competitor module enabled, we set up a fixed competitor set per client and country in sugarLENS. Their public Instagram business profiles are snapshotted daily with followers, posts and engagement, to track development over time. Paid activity comes from the official interface of the TikTok Commercial Content Library. An ad only counts as "running" if it was delivered in the last seven days, not merely flagged active. We use official interfaces only, no scraping.
On top comes a weekly market read with sources. The real lever: market observation and your own performance share the system that ranks your own creatives and evaluates the best and weakest with AI video analysis. A test of a market idea can then be measured directly on your own numbers.
FAQ
Is it allowed to analyse competitors' ads?
Yes. Meta's and TikTok's ad libraries exist for exactly this transparency. Taking over creatives one to one, however, can infringe copyright and trademark rights.
Can you find out a competitor's spend?
Not reliably. The Meta Ad Library only shows spend for political and social issue ads, and even then only as a range per ad.
How long does an ad have to run to count as successful?
There is no fixed threshold. As a rule of thumb, ads running for 30 days or more deserve a closer look. Run time alone is never proof.
How many competitors should you track?
Three to six are usually enough. More important is a fixed set that is reviewed the same way every month.