Five ad accounts, one question
Every campaign ends with the same question in the meeting: which creative worked, and why? The answer rarely sits in one place. Meta shows its numbers in Ads Manager, TikTok in its own, YouTube in Google Ads, Snapchat and Reddit somewhere else again. Add spreadsheet exports, a reporting deck and the gut feeling of the team that produced the assets.
JUSTADDSUGAR answered that question for brands for years, every time by hand. sugarLENS is the answer that grew out of it: a social media and creative analytics platform built by the Hamburg agency itself, in daily use since March 2026.
What sugarLENS does
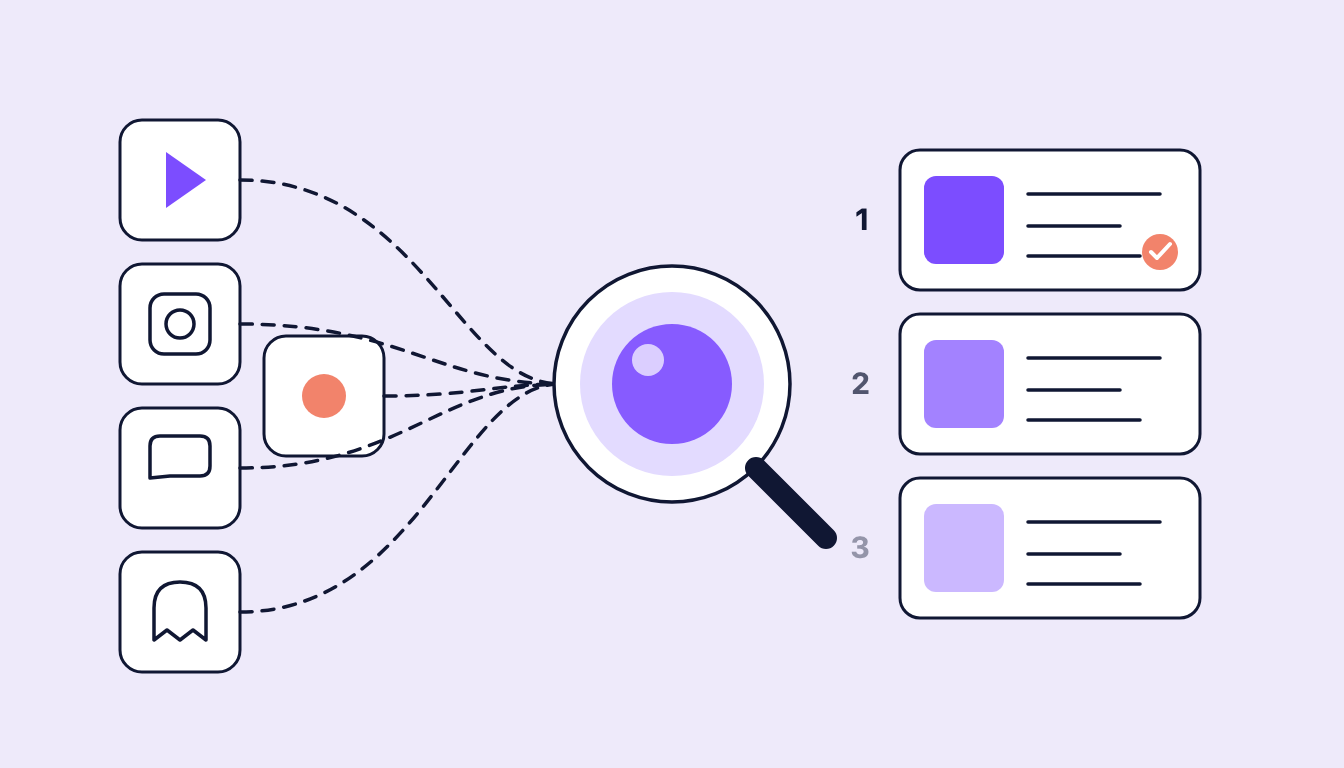
sugarLENS reads advertising data from every platform through the official interfaces and puts it in one dashboard: spend, impressions, clicks, watch time, engagement and conversions, filterable by period, country and campaign status. So far, that is a dashboard.
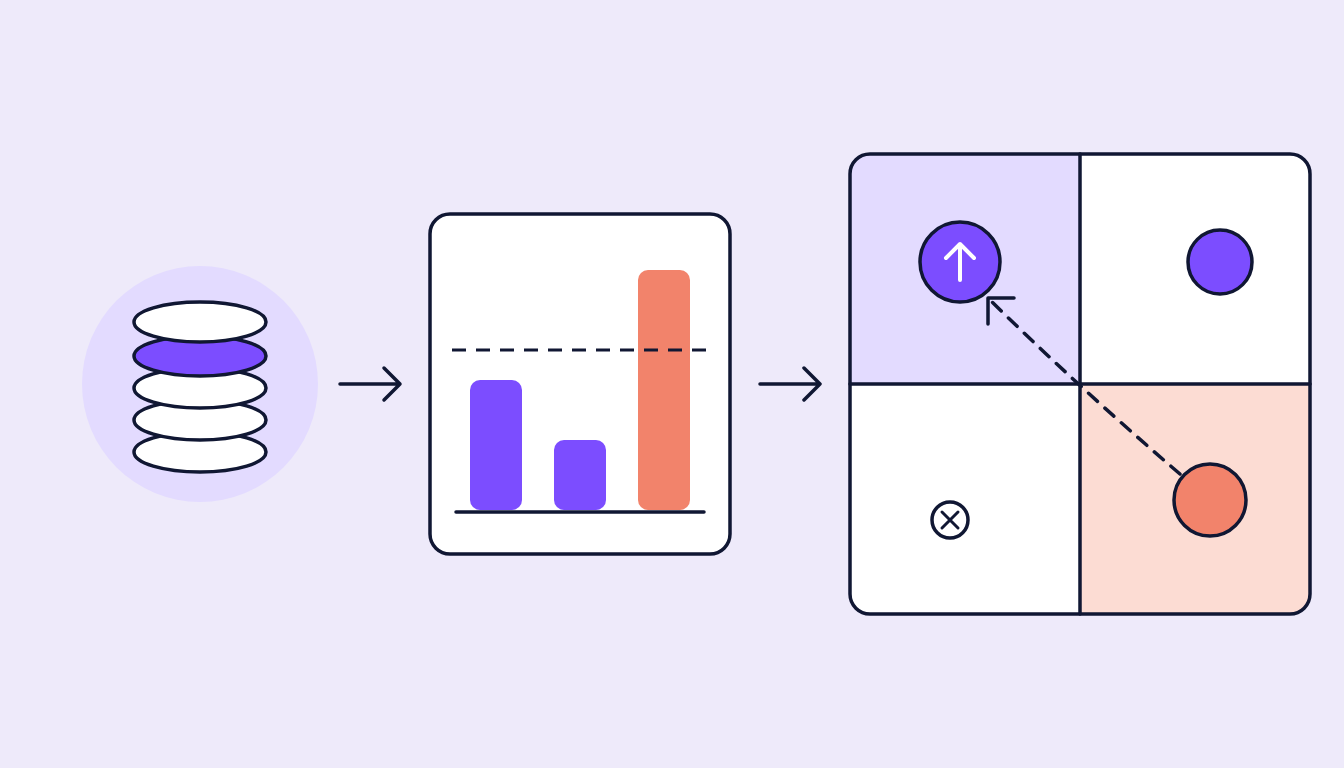
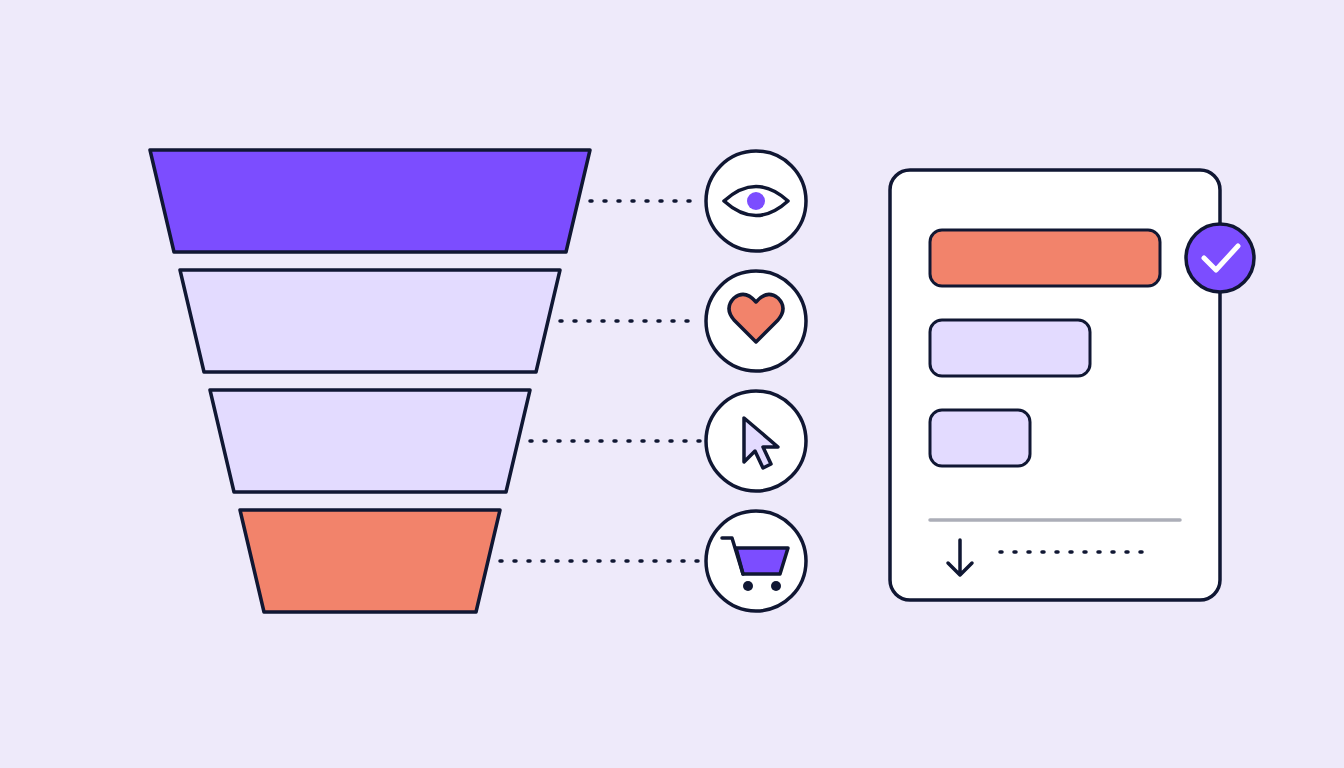
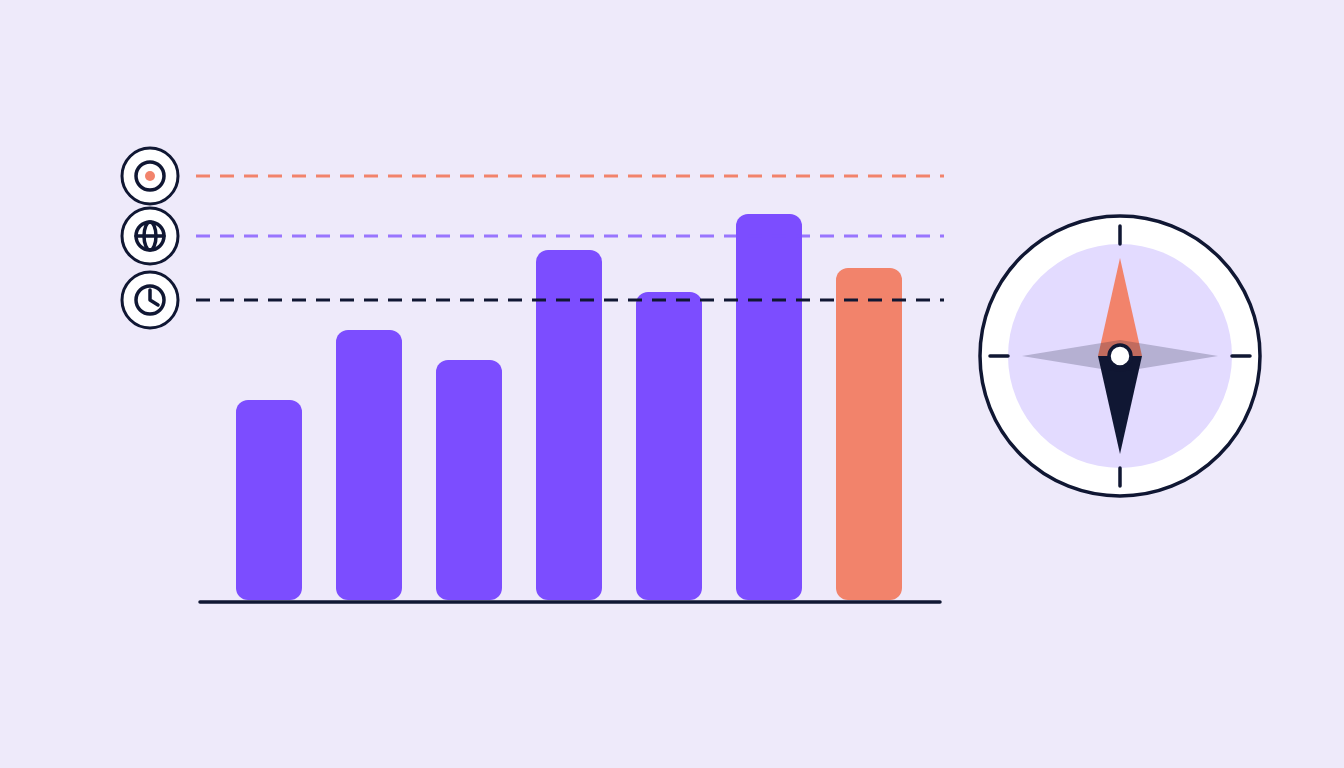
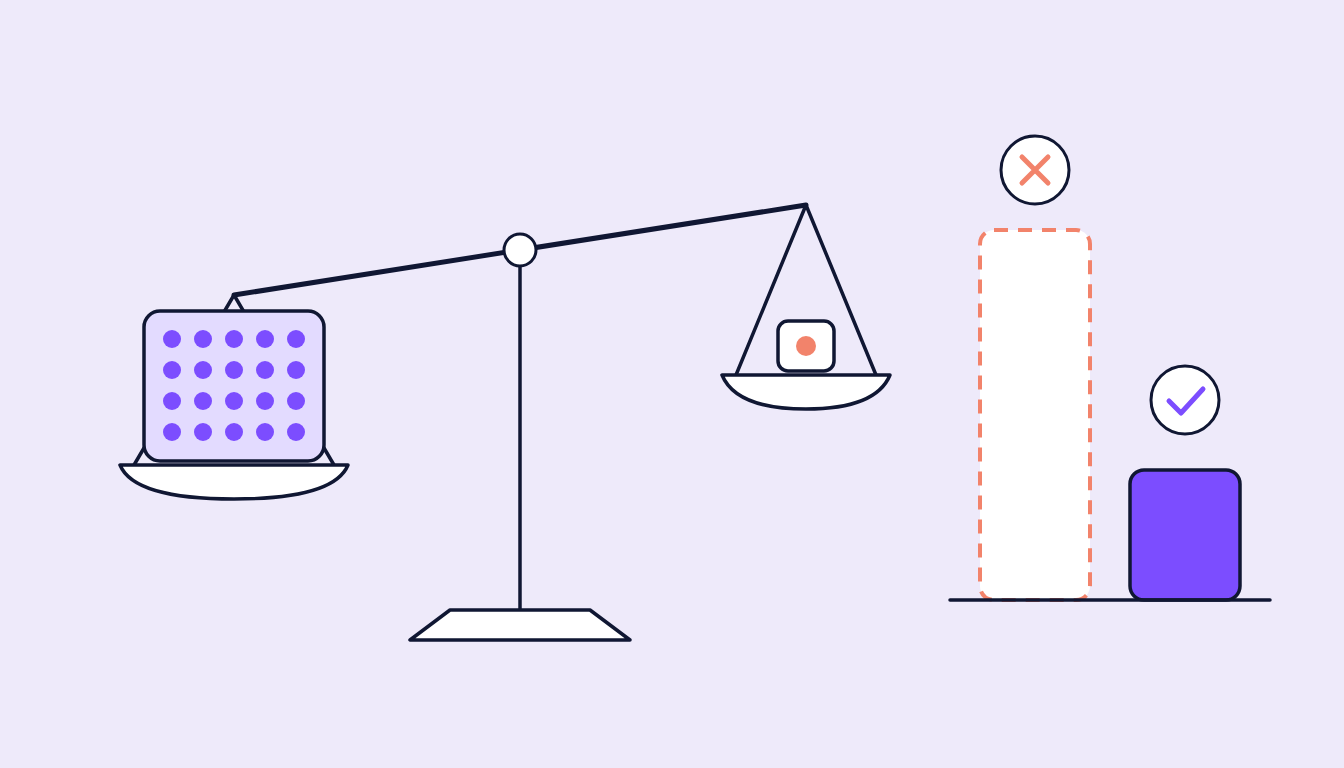
The difference starts with the creative. Every asset is ranked on the metric it was bought for: watch time for branding, engagement rate for consideration, CPC or cost per order for traffic and sales. An awareness video is never judged on its CPC, and a conversion asset never on its watch time. The reference comes from the account itself, the previous quarter, or the whole JUSTADDSUGAR portfolio.
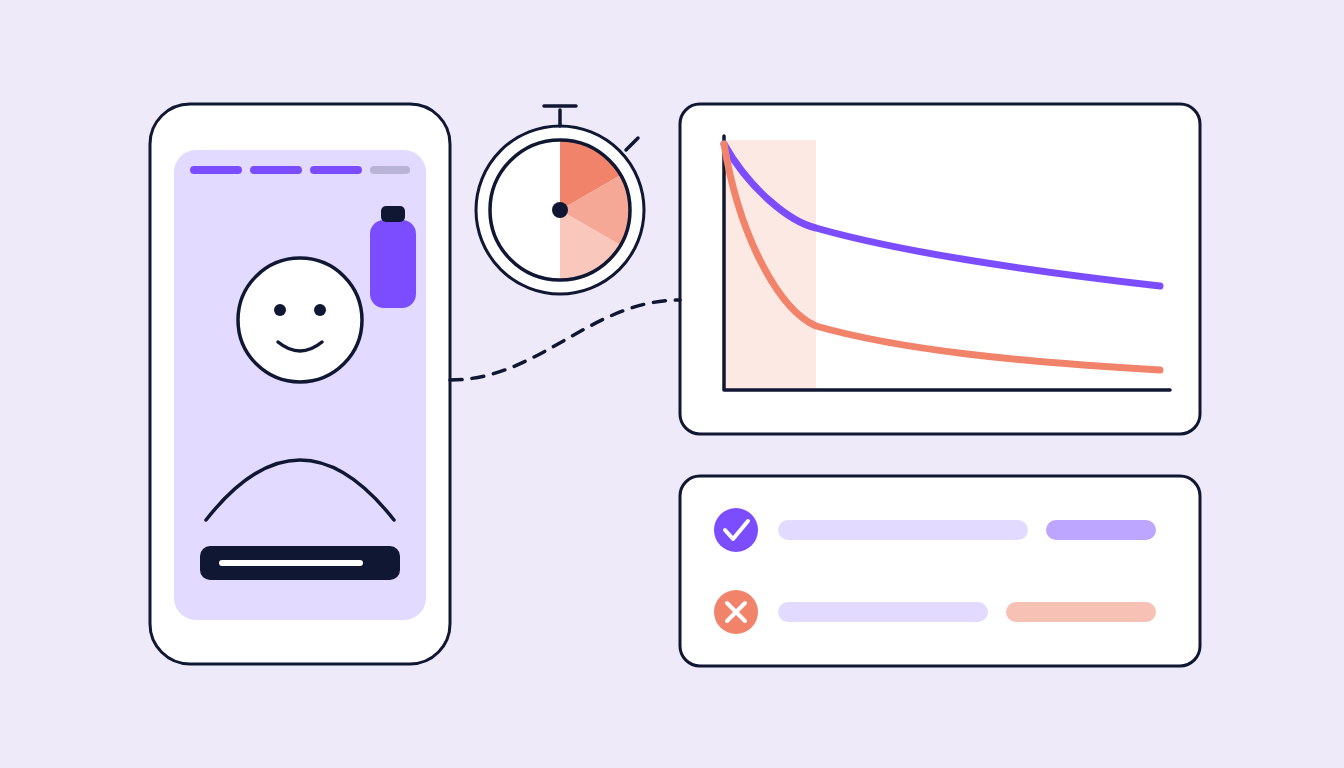
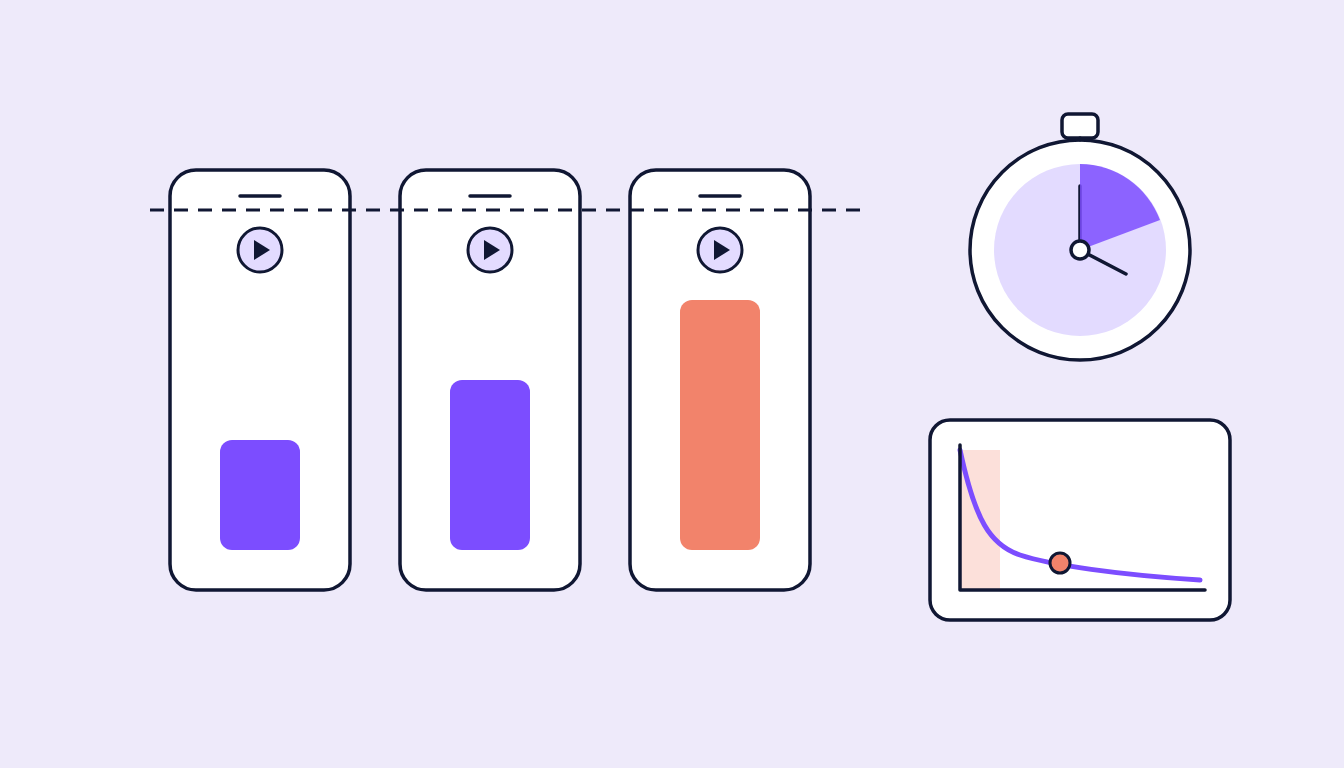
Then an AI watches the best and the weakest videos. Not a still frame, the whole video: hook, structure, pacing, when the brand first appears, how many viewers are still there at that second. The result is one plain sentence on why an asset sits above or below the benchmark, and a short list of what to repeat and what to avoid.
Why an agency builds something like this
Because otherwise the learnings get lost. An external tool says your CPC is above the industry average. It does not say that videos with a product demo in the first three seconds click cheaper than atmospheric openings in exactly this account. That second statement needs your own data, your own creatives, and someone who knows both.
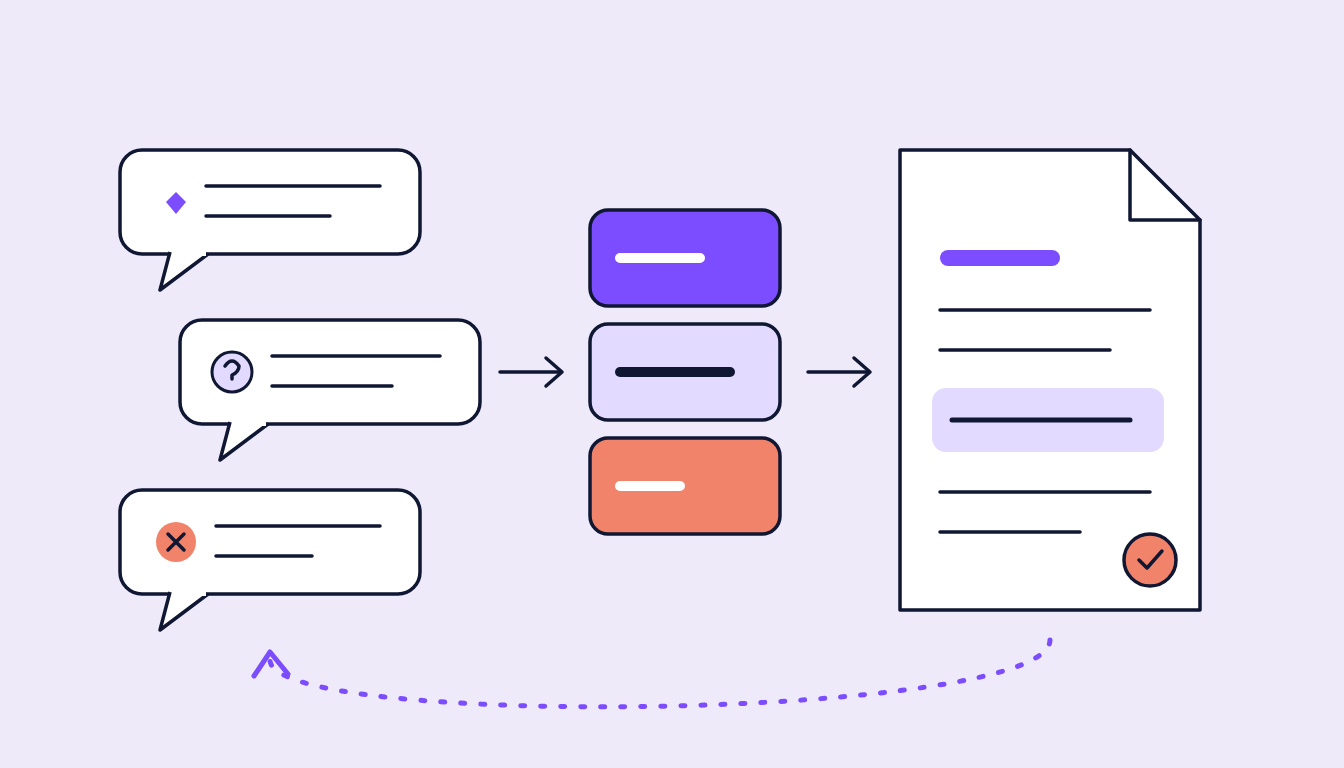
That is why sugarLENS is the analytics half of the agency's stack. What the platform learns about a brand flows back into the next brief as a learning, with a note on how solid the pattern is: confirmed by the numbers, only the team's taste, or a case where gut feeling and performance disagree.
What else is in there
A lot has grown around the ranking because the media teams needed it day to day:
- Demographics and countries: age, gender and regions per platform, with a map.
- Organic performance: posts, followers and interactions next to the paid numbers, without ad delivery inflating organic views.
- Community management: comments from every channel in one inbox, with sentiment analysis and moderation.
- Competitors and market: benchmarks against a defined competitor set and a weekly market read with sources.
- Planning and forecast: media plan, budget control and projections with confidence intervals.
- Monthly report: the month as a slide deck, from the same numbers as the dashboard, editable and exportable to PowerPoint.
- sugarChat: an assistant that runs the same queries as the dashboard and therefore quotes the same numbers.
Who sugarLENS is for
Brands and agency teams running paid social on several platforms who want their reporting to say not only what happened but why. Clients see their own accounts in their own login, with exactly the tabs shared with them. Data lives in the EU, the AI analysis runs in the EU, and every number in the deck can be traced back to the ad.
If you want to see it: a live demo with sample data runs on the home page, no login needed.