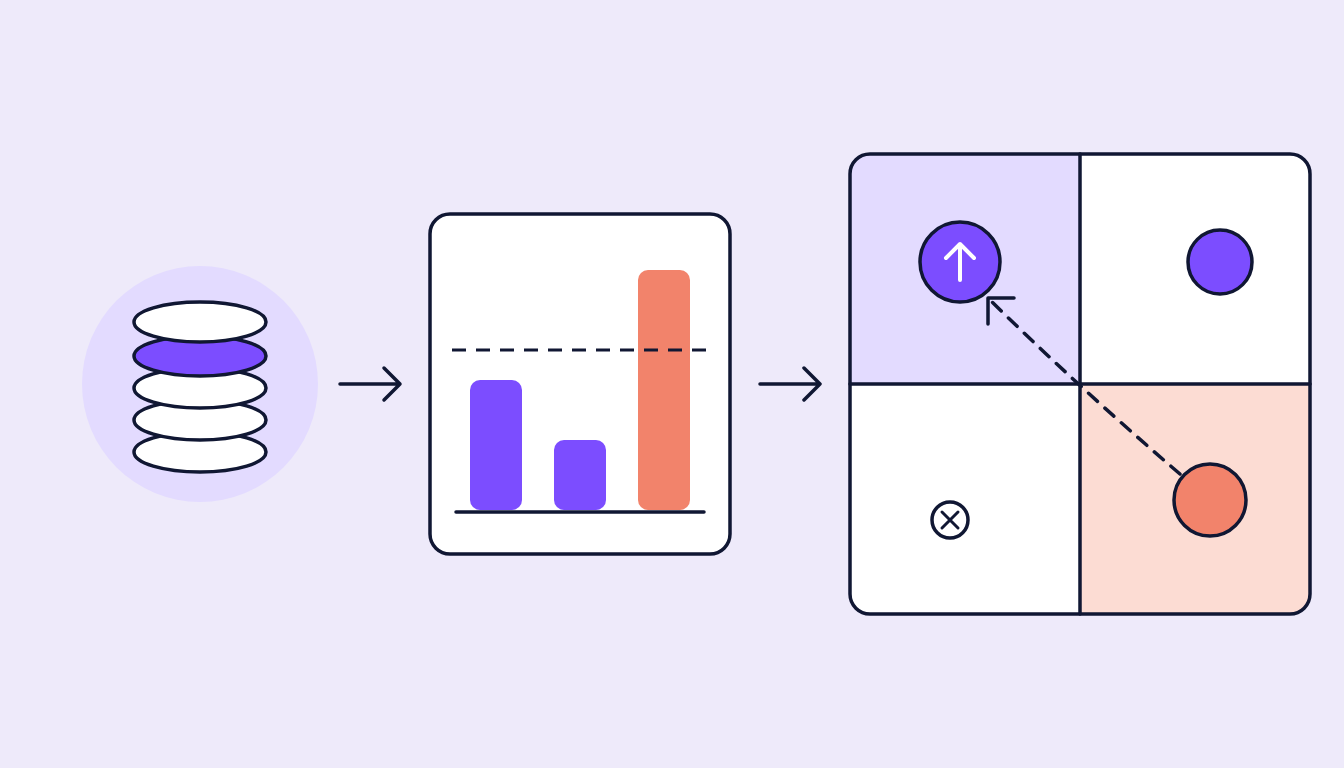
The forecast looked good. The reporting afterwards did not.
The campaign was expected to hit its goals. Then comes the month-end review: reach below plan, CPC above expectation, Average Watch Time weaker than in the last flight. The publisher benchmark still says: everything in the green.
So what now? Did the campaign perform poorly? Was the forecast too optimistic? Is the creative weak? Or was it simply compared against the wrong value?
And this is where it becomes clear: a benchmark is not a verdict. It is a point of comparison. Whether it helps depends on what we compare, with whom and against which objective.
Three benchmarks, one clear view
To measure success properly, we need three perspectives:
- Historical benchmarks: How is the current campaign performing compared to your own previous results?
- Vertical and geo benchmarks: How does it compare to publisher or market values for the industry and region?
- Objective benchmarks: How does the performance fit the specific campaign goal and the funnel phase?
Historical values are often the most honest comparison because they fit your brand, audience and setup. For example, we compare the current CPM, CPO or Average Watch Time with similar assets of our own.
Publisher benchmarks from Meta, TikTok or YouTube help with external context, especially in new markets or where historical data is lacking. The catch: they usually show where a value sits, but not what we should change. A below-average Average Watch Time doesn't explain whether the hook was too weak, the message too late, or the video too long for the platform.
And then there are the objectives. Awareness, consideration and action have different jobs and need different KPIs. An awareness creative can be strong even if it doesn't have the highest ER. A conversion asset can have a higher CPM and still deliver the better CPO. The job of the creative decides.
Internal vs. industry: The difference lies in the learning
Industry and publisher benchmarks help with context. Internal benchmarks help with improvement.
An external benchmark says: your CPC is above average. An internal creative benchmark can show: assets with a clear product demo in the first three seconds achieve a lower CPC in your setup than atmospheric openings.
The second learning is closer to an action. It helps with the next briefing, with creative testing and in production. Internal data makes measures traceable: What does a new hook bring? What does a different creator change? What effect does a shorter video length have? Which CTA pays off in CPC or CPO?
Of course: an internal result is not automatically causal proof. If several variables were changed at the same time, the conclusion remains limited. Clean comparison groups and a sound test design remain mandatory.
sugarLENS: Benchmarking becomes Creative Intelligence
This is where sugarLENS comes in. JUSTADDSUGAR's Performance Brain for social media and creative analytics brings together advertising data from Meta, YouTube, TikTok and more in one dashboard, ranks creatives and translates performance into concrete creative learnings.
The difference from pure reporting: sugarLENS doesn't stop at "above or below average".
- Creatives are ranked by the KPI that matches the campaign objective.
- Spend thresholds keep low-spend flukes out of the top rankings.
- The drilldown leads from the portfolio to the individual creative, including by account, country, placement, demographics, as well as paid and organic.
- AI Vision analyzes winners and losers by features such as hook, pacing, image composition and CTA placement.
- Do and don't learnings point to the ads they were derived from.
- KPI forecasts and anomaly alerts make deviations visible before they get lost in the monthly report.
This turns "Asset B is above benchmark" into a usable question: Which creative decision might have made the difference, and what do we test next?
sugarLENS thus combines external orientation, internal comparability and concrete creative insights. Publisher benchmarks set the frame of reference. Your own data shows what works in your setup. The creative analysis delivers the next step.
Conclusion: Benchmarks are a compass
Social media success is not measured by whether a number is above or below an average. The value comes from the context.
Historical benchmarks show your own development. Vertical and geo benchmarks help with external context. Objective benchmarks prevent awareness, consideration and action from being wrongly compared with each other.
sugarLENS brings these perspectives together and takes them down to the creative level. This turns reporting from a graveyard of numbers into a foundation for better briefings, smarter creative tests and stronger content brands.
This is the sweet spot between performance and creation: Data in, better creatives out.