The report is done. The decision is missing.
End of the month, the report is ready: 40 slides of spend, impressions, clicks and conversions. Then leadership asks: "So what do we do with the budget now?" Silence.
Many ROI reports answer what happened. That is only half the job. You don't prove the value of social media with one big number. You prove it with a decision that follows from the numbers: scale this creative, fix that one, stop the third.
The path there is always the same. Spend, then results, then a comparison with a benchmark, then a decision. Drop one link and the report stays descriptive.
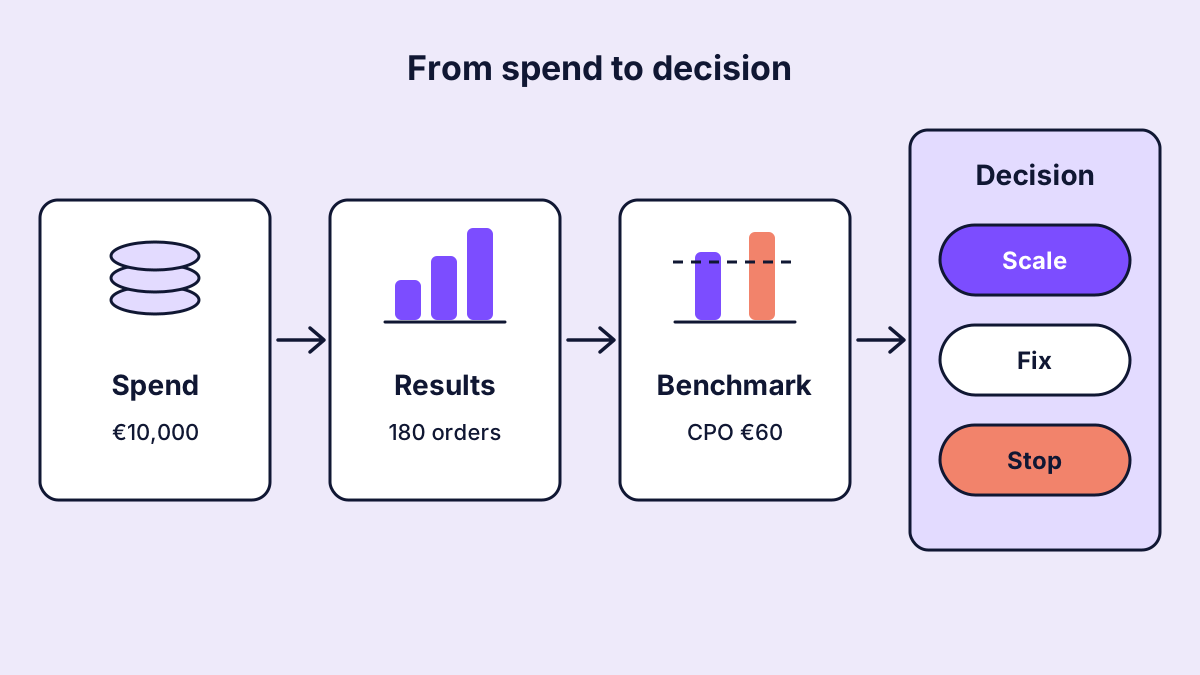
Figure 1: Proving ROI ends at the decision, not at the result.
Return means something different per objective
A typical mistake: everything gets measured on ROAS. That is right for a sales campaign, and unfair for an awareness video that was never booked to sell.
So first clarify what job the budget had, and define the return from there:
- Awareness: return is attention at a reasonable cost. The relevant metrics are CPM, reach, frequency and above all average watch time.
- Consideration: return is people engaging with the brand. Engagement rate, shares, saves and comments count here.
- Traffic: return is qualified visits. The lead metric is CPC based on link clicks, backed up by landing page views.
- Performance: return is orders or leads. The lead metrics are CPO or cost per lead and, where revenue data exists, ROAS.
So an awareness creative only competes with other awareness creatives. Rank a branding video against a conversion ad and the result can't carry a decision.
The cost metrics that make return tangible
Cost-based metrics translate spend into value, bridging the media budget and the business result.
CPM = spend / impressions × 1,000
CPC = spend / link clicks
CPO = spend / orders
ROAS = revenue / spend
For CPM, CPC and CPO lower is better, for ROAS higher. A ROAS of 3 means every euro spent brought in €3 of revenue. That is not yet profit, because margin, returns and production costs are missing. If you want to show real ROI, set the contribution margin against the total cost, meaning media plus production.
Two calculation mistakes keep showing up:
- Averages of averages. The CPC across five campaigns isn't the mean of the five CPCs, it is total spend divided by all clicks. Otherwise a campaign with a €50 budget counts as much as one with €50,000.
- The wrong clicks. "All clicks" also include profile visits, likes and clicks to expand an image or video. For CPC and CTR only link clicks count, meaning clicks that actually lead to the destination.
What attribution can and can't do
Platforms report the conversions they credit to themselves. By default, Meta counts conversions up to 7 days after a link click and up to 1 day after another interaction with the ad or a mere view. Other platforms use their own windows. That leads to three limits:
- Overlap. If someone saw an ad on TikTok and later clicked one on Meta, both platforms often claim the same order. The sum of platform conversions can therefore exceed the actual shop orders.
- View-through. A conversion after a view alone is a signal, not proof. Some of those buyers would have bought without the ad.
- Different windows. Platforms with different attribution windows aren't directly comparable.
The practical answer: compare within one platform, where the rules are the same. For the overall statement, reconcile the platform total with shop or CRM data. Where a lot of budget is at stake, lift or holdout tests show the true incremental effect. And say openly which number comes from where.
Spend share times performance: the 2x2 matrix
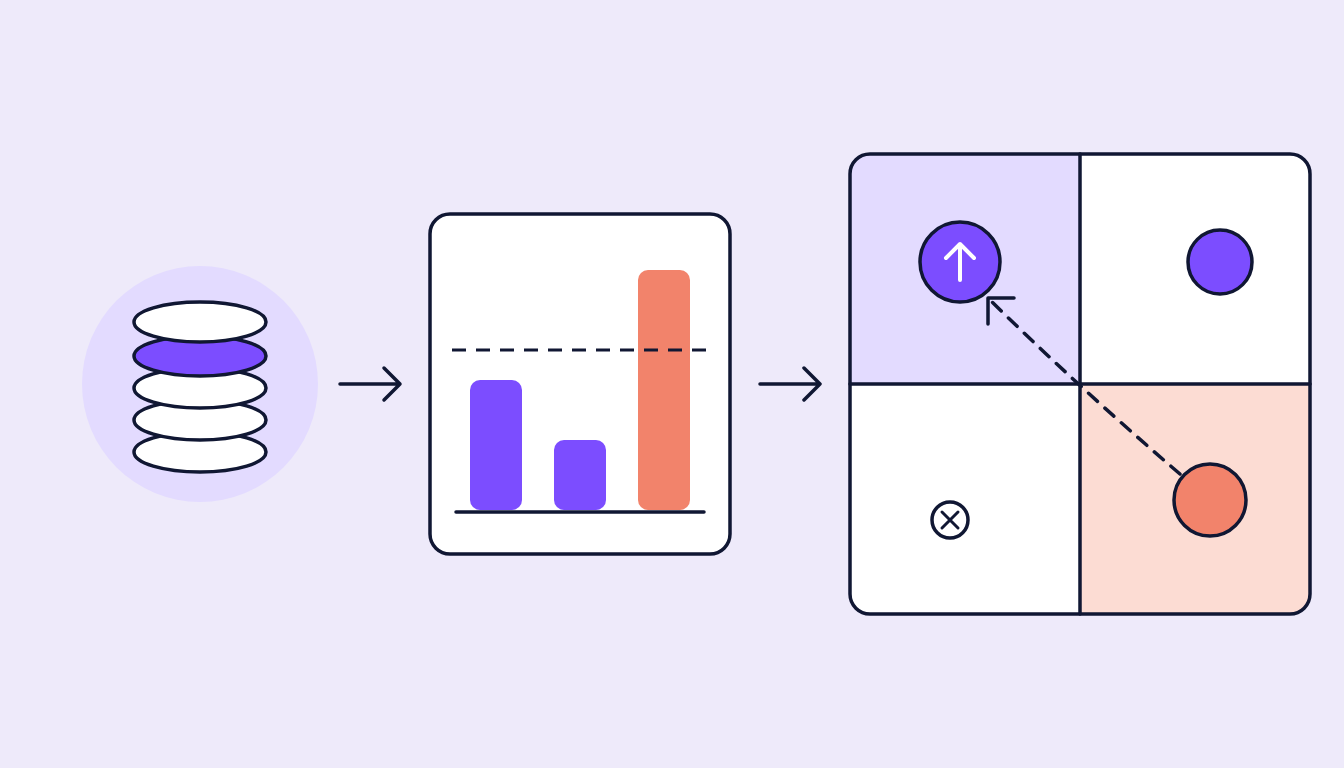
This is where report turns into decision: instead of reporting spend and performance separately, you cross them. For every creative or campaign, two questions: does it get a lot or a little of the budget? Is its lead KPI better or worse than the benchmark?
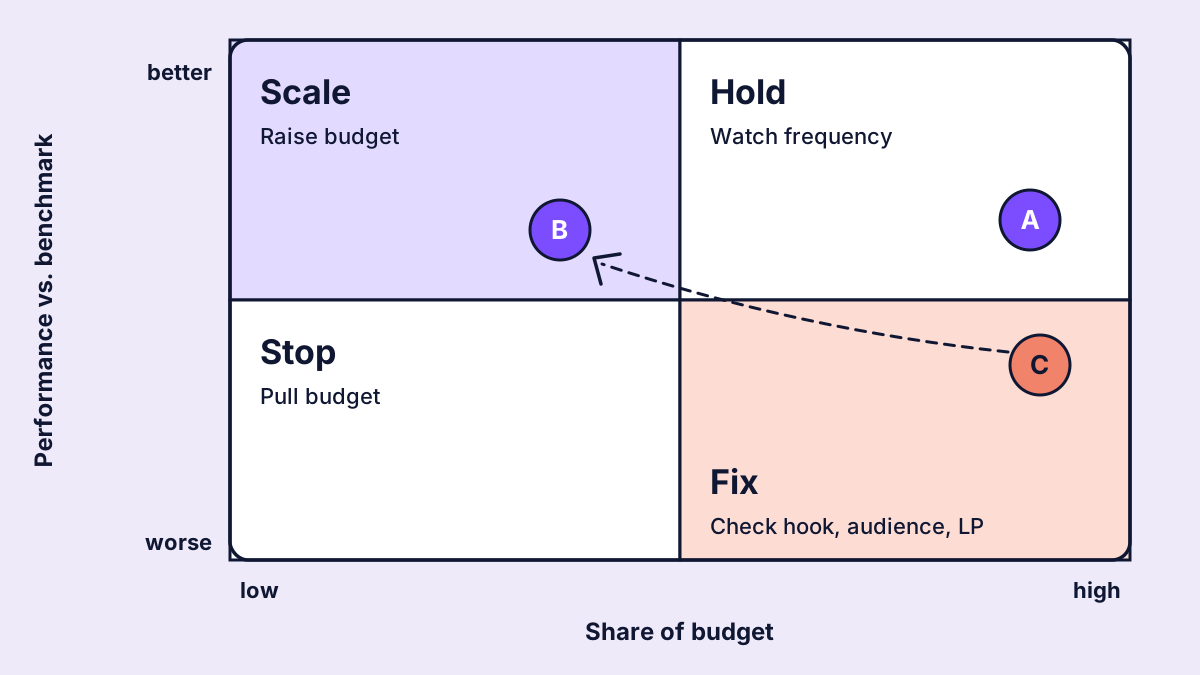
Figure 2: Spend share against performance. Each quadrant has its own action.
- High budget, good performance: hold. The workhorses: watch for rising frequency and fading performance.
- Low budget, good performance: scale. Raise the budget step by step and check whether the KPI holds.
- High budget, weak performance: fix or reallocate. This is where most money burns. Check the hook, audience or landing page, otherwise pull budget.
- Low budget, weak performance: stop. No more euros.
A worked example: suppose three creatives in a sales campaign share €10,000, the CPO benchmark from the previous quarter is €60, and an average basket brings €80 in revenue. Creative A gets €5,000 and drives 100 orders (CPO €50, ROAS 1.6). Creative B gets €1,000 and drives 40 orders (CPO €25, ROAS 3.2). Creative C gets €4,000 and also drives 40 orders (CPO €100, ROAS 0.8).
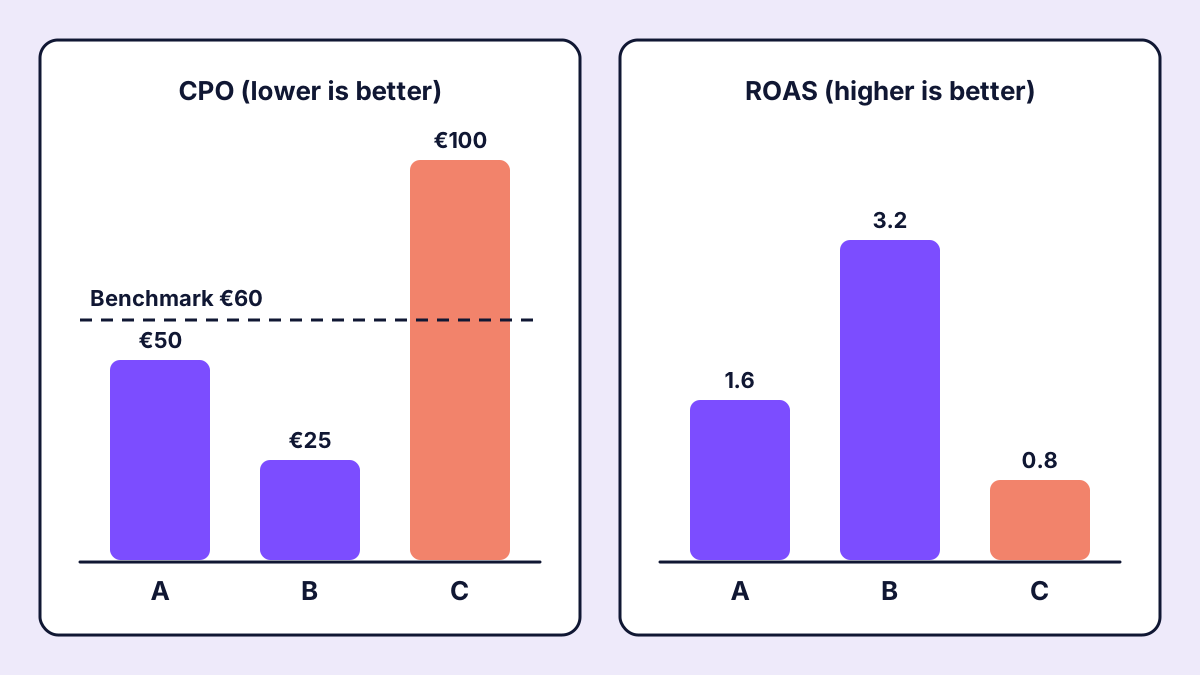
Figure 3: Worked example. B delivers the best CPO on a tenth of the budget.
The decision: hold A, scale B, fix C or move part of its budget to B. Two guardrails come with it. First, each side needs enough volume: 40 orders is solid, three would be chance. Second, prioritise by money at stake, not by percentage gap.
How it lands with management
Management wants to know whether the money is well spent and what changes. An ROI report that lands is short and follows a fixed order:
- The decision first. "We are moving €2,000 from C to B" sits at the top, the reasoning follows.
- Return per objective. One lead KPI per funnel stage against its benchmark, not ten metrics per platform.
- The matrix. One slide where every campaign sits in its quadrant.
- The limits. One sentence on attribution, so nobody mistakes platform conversions for shop revenue.
- The look back. What was decided last month, and did it work?
The fifth point is often forgotten, yet it is the strongest proof of ROI: a decision whose result you can show a month later.
How sugarLENS does it
sugarLENS rankings measure every creative on its campaign objective's lead KPI: average watch time for awareness, engagement rate for consideration, CPC for traffic, CPO for performance. Rates such as CPC and CPO are calculated from totals. On Meta, TikTok and YouTube only link clicks count for CPC and CTR.
The key takeaways cross spend and performance instead of reporting them separately. sugarLENS only suggests more budget for a creative that, inside the same campaign, runs on clearly less budget and performs clearly better, when both sides have a minimum volume of clicks, orders or impressions. Findings are sorted by money at stake, weighted by the gap. The monthly report (for clients only once shared) builds a slide deck from the same numbers as the dashboard.
FAQ
Is ROAS the best metric for social media ROI?
Only for campaigns meant to sell. For awareness and consideration, watch time, CPM or engagement rate fit better.
Why don't platform conversions match the shop?
Every platform credits conversions by its own rules, including view-through, so the same order is often counted more than once. Reconciling with shop or CRM data shows the order of magnitude.
When is a creative comparison reliable?
When both sides have enough volume, say a few dozen orders or several thousand impressions. With very small numbers, chance decides.
What belongs in an ROI report for management?
The decision, return per objective against a benchmark, a spend and performance matrix, one sentence on attribution limits, and the effect of last month's decisions.