Three creatives, three winners
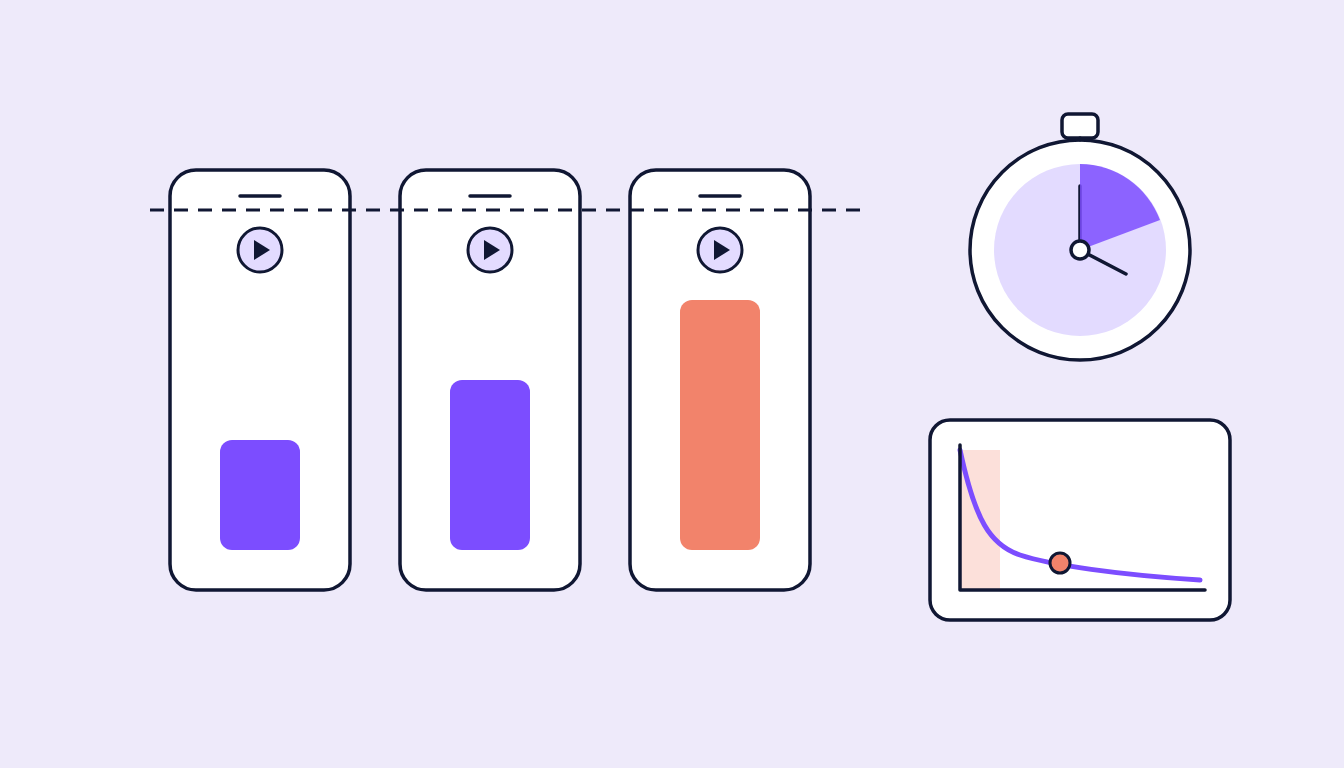
A reporting meeting, three videos, one question: which was best? Sort by CPC and you get one answer, by watch time another, by engagement maybe a third. All three add up. Only one fits the goal the budget was booked for.
This guide is not another KPI glossary. It answers a narrower question: which metric leads at which funnel stage, which ones stand guard beside it, and why the campaign objective decides this rather than the loudest voice in the meeting.
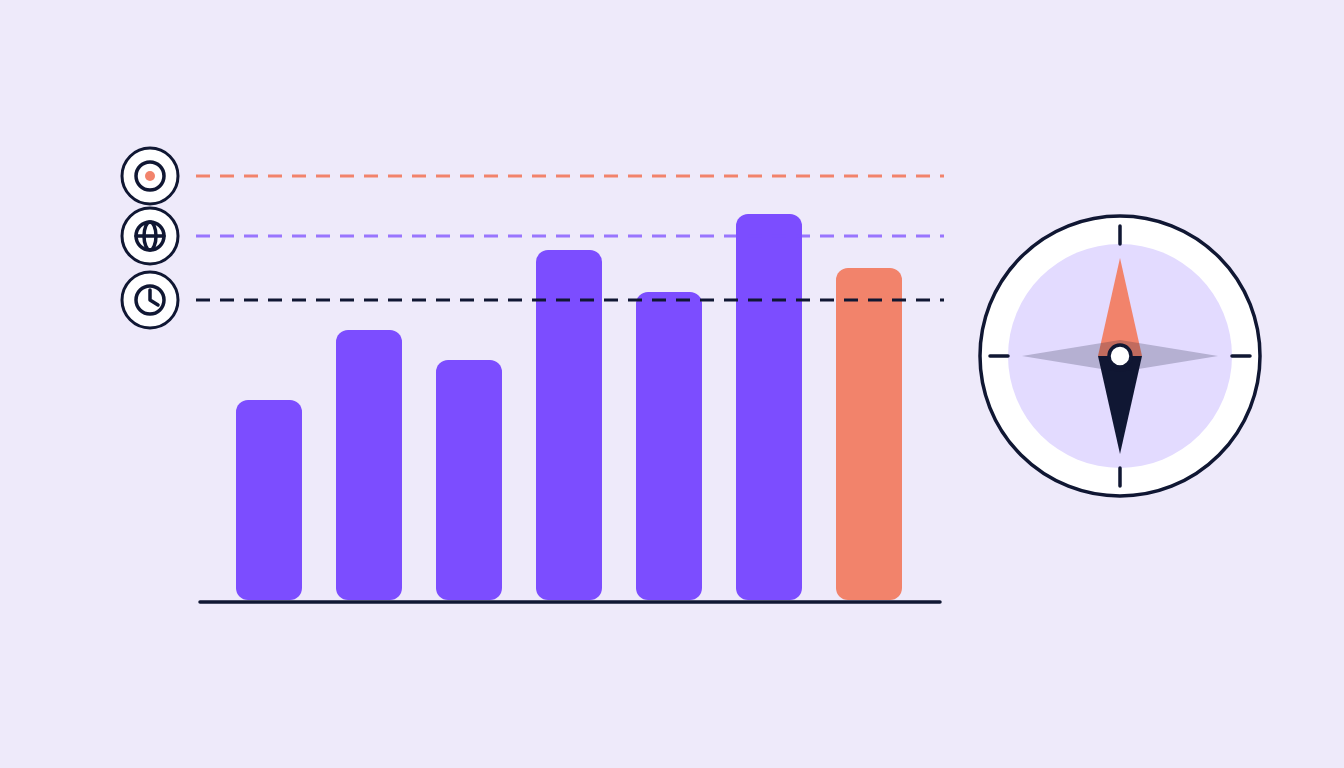
The rule in one sentence: one lead KPI per stage that you rank by, plus two or three guardrails that expose a hollow win.
The objective decides, not your favourite number
Every platform optimises for what you book. A Meta awareness campaign looks for people likely to watch, not to click. A traffic campaign looks for clickers. A sales campaign looks for buyers.
So the KPI in your report has to match what the platform optimised for. Anything else grades a creative on a job it was never given.
Where the objective lives differs by platform:
- Meta: the campaign objective (such as awareness, engagement, traffic, sales) plus the ad set's optimisation goal, for example ThruPlay (15 seconds or watched to the end).
- TikTok: the campaign objective plus the ad group's optimisation goal, for example Focused View (at least 6 seconds watched, or an interaction within them).
- Google and YouTube: no objective field in the data; campaign type and bidding strategy (such as target CPV or maximise conversions) decide what gets optimised.
Four stages, four lead KPIs
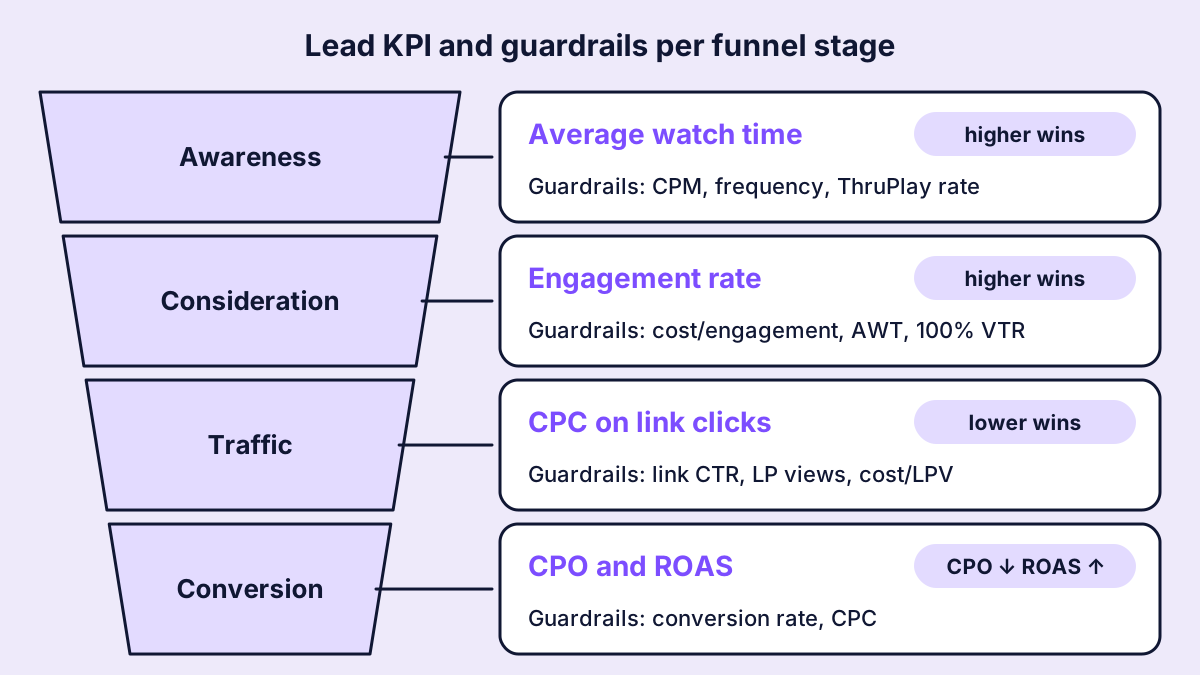
Figure 1: One lead KPI per stage, with the guardrails that reveal a false win.
Awareness: average watch time
In awareness, the product is attention. Reach only says a video was delivered. Average watch time (AWT) says how long people actually watched. Higher wins.
Guardrails: CPM (was the attention affordable?), frequency (is the same person seeing the video too often?) and the ThruPlay or completion rate. A high AWT at twice the account's usual CPM is attention bought at a premium, not a win.
Consideration: engagement rate
Here a creative should trigger a response: likes, comments, shares, saves. The engagement rate relates those interactions to delivery. Higher wins.
Engagement rate = Engagements / Impressions
Guardrails: cost per engagement, AWT (is the video actually watched, or just liked in passing?) and the 100% view rate. And read the comments: lots of angry reactions is not good engagement.
Traffic: CPC on link clicks
In traffic campaigns the job is a website visit. The lead KPI is CPC on link clicks. Lower wins.
CPC = Spend / Link clicks
Guardrails: link CTR, landing page views and cost per landing page view. A cheap CPC where half the clicks never reach the page points to accidental clicks or a slow page.
Conversion: CPO and ROAS
At the bottom of the funnel, the sale counts. The lead KPI is cost per order (CPO), spend divided by purchases. Lower wins. Where basket values are passed back cleanly, add ROAS, since a cheap order with a small basket can be worth less than a pricier, larger one.
CPO = Spend / Purchases
ROAS = Revenue / Spend
Guardrails: conversion rate and CPC. In lead campaigns, cost per lead takes the place of CPO, since there are no purchases there.
The wrong KPI crowns the wrong winner
A worked example. Suppose an awareness campaign runs three videos with a budget of €1,000 each:
| Creative | Link clicks | CPC | AWT |
|---|---|---|---|
| A: product demo with a hard CTA | 2,000 | €0.50 | 3.1 s |
| B: storytelling | 800 | €1.25 | 9.4 s |
| C: creator video | 1,250 | €0.80 | 6.2 s |
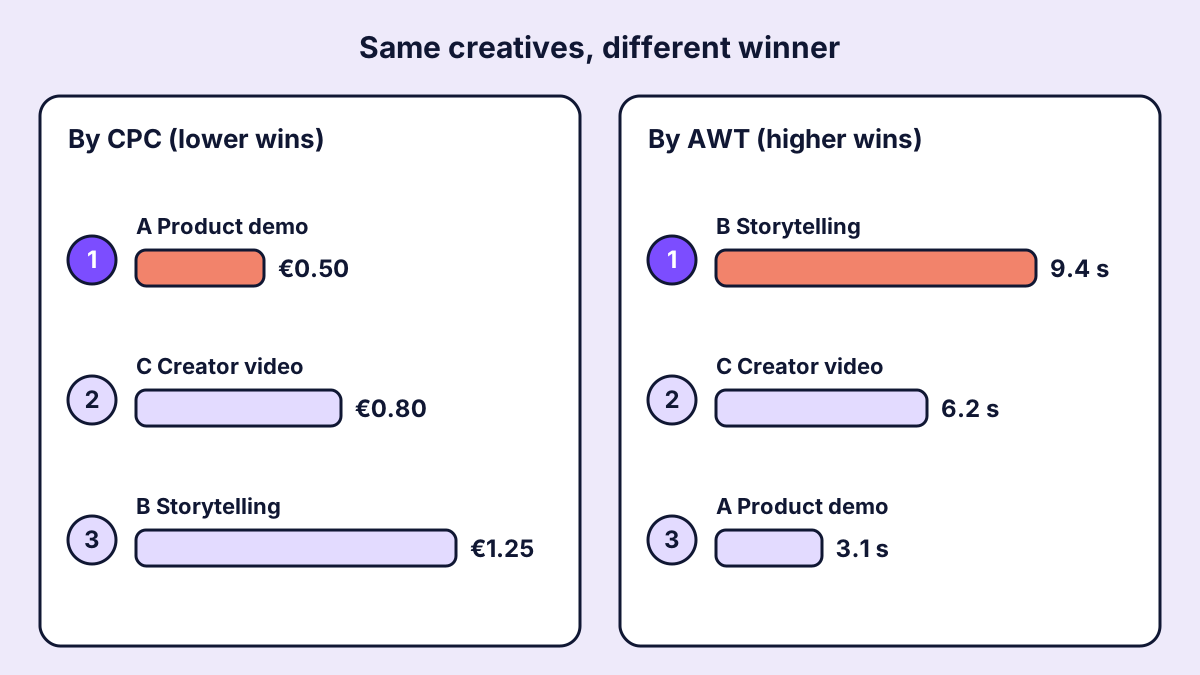
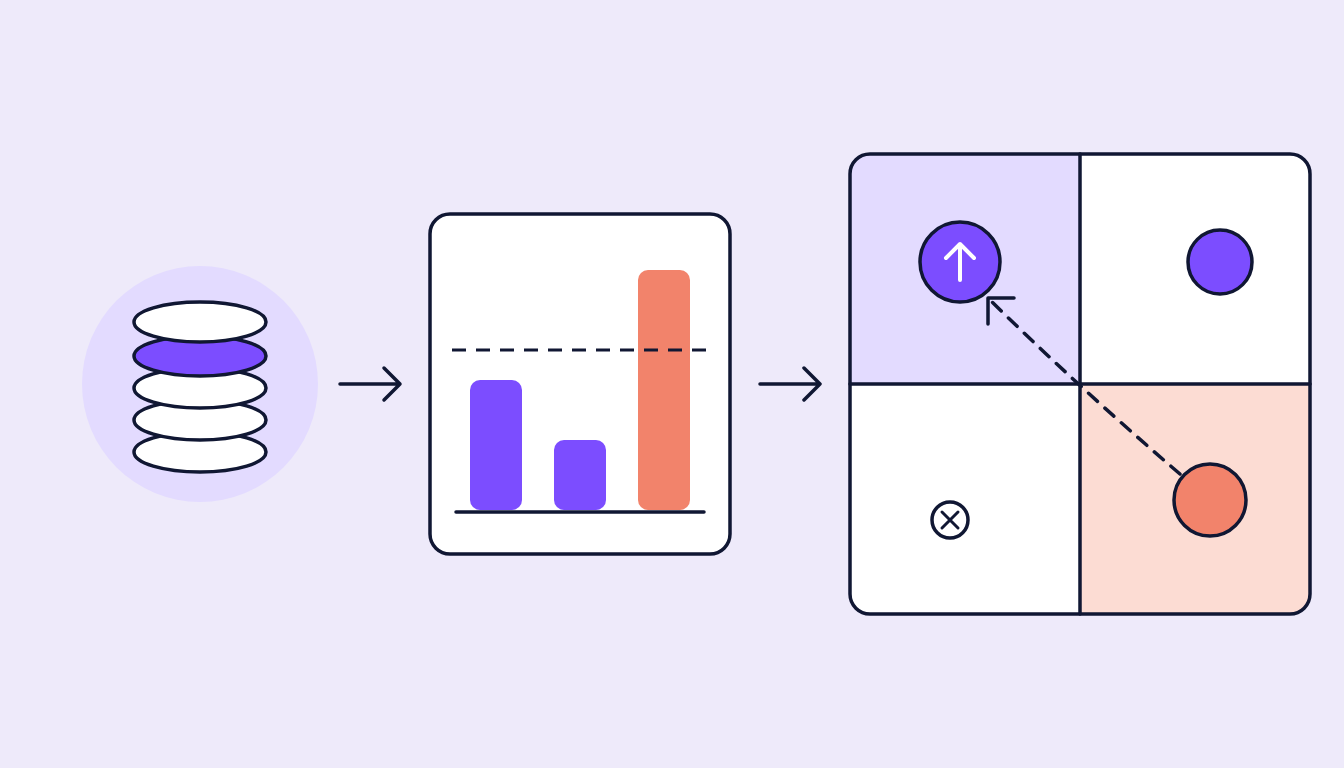
Figure 2: The same three videos, two rankings, two different winners (worked example).
By CPC, A wins comfortably. By AWT, B wins and A comes last. For an awareness campaign the second ranking is the right one: A collects clicks nobody asked for and loses people after three seconds. Crown A and the next awareness video gets briefed as a click ad, and the brand effect never shows up.
The reverse holds too: ranking a conversion campaign by watch time rewards beautiful videos that sell nothing.
Two rules prevent this:
- Only rank within a stage. An AWT is never compared with a CPC, not even in a mixed overview.
- Show the number you ranked by. If rank 1 shows a different figure from the one the list was sorted on, nobody trusts the ranking for long.
Link clicks, not all clicks
Not every CPC is the same CPC. Besides link clicks, Meta reports "clicks (all)", which adds profile clicks, expanding the ad text, opening media full screen and other interactions. For YouTube campaigns, the "interactions" column in Google Ads counts views or engagements by ad format, not plain clicks. On TikTok, the API's clicks field already counts only clicks to the destination, while the "clicks (all)" column in Ads Manager also includes social interactions such as profile visits.
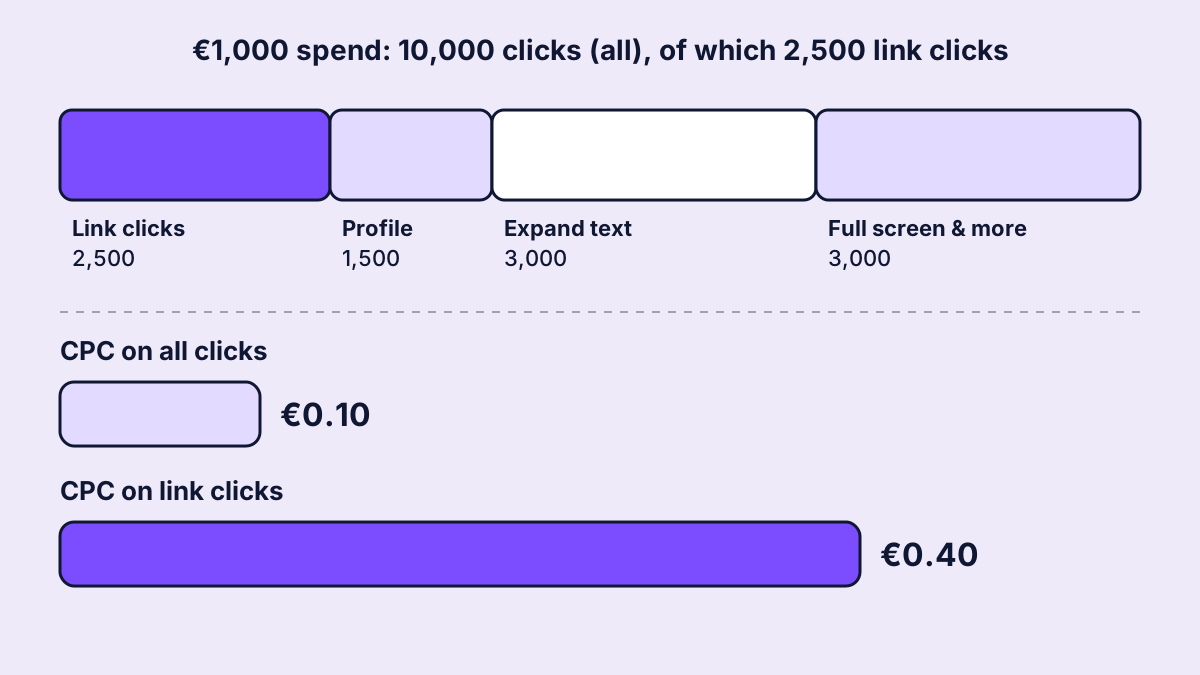
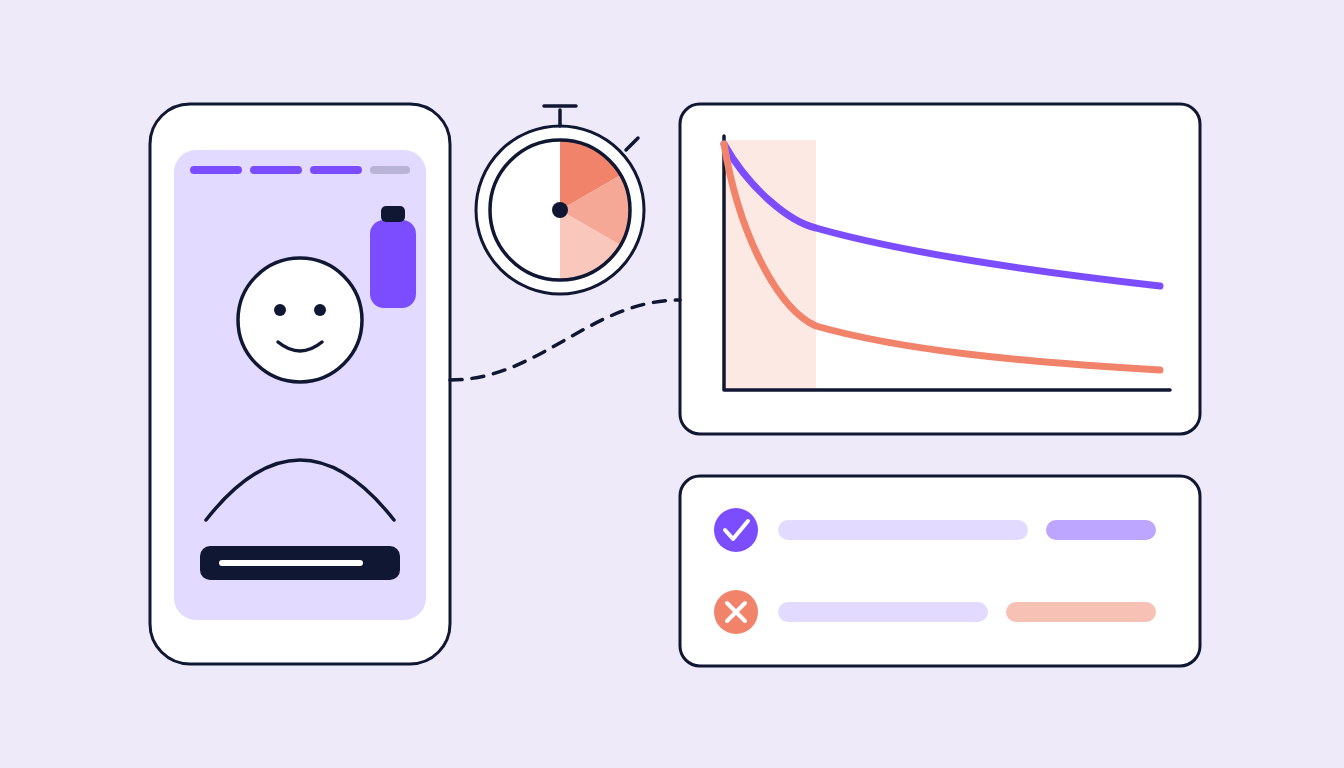
Figure 3: Same spend, two click definitions, a fourfold difference in CPC (worked example).
Suppose €1,000 of spend produces 10,000 clicks in total but only 2,500 link clicks. On all clicks the CPC is €0.10, on link clicks €0.40. So CPC and CTR should always use link clicks, defined the same way on every platform, or cross-platform comparisons are worthless.
Aggregate rates the right way
One last trap is the arithmetic. Average a month's CPC from 30 daily values and you get a different number from spend divided by clicks, because a small, expensive day counts as much as a big one. Always divide sum by sum: total spend by total clicks, total engagements by total impressions.
How sugarLENS handles it
In sugarLENS, ranking follows the funnel. Each stage in the rankings sorts by its lead KPI: awareness by AWT, consideration by engagement rate, traffic by CPC, performance by CPO. The stage comes from the campaign objective, or on Google from the campaign type. A branding asset's optimisation goal decides whether it sits under awareness or consideration. Each asset shows what it was optimised for, and the creative view can filter by it. On Meta, TikTok and YouTube, clicks are link or destination clicks, and ranking rates are calculated from base sums for the selected period.
Every ranking card leads with the number its stage is sorted by. The strongest and weakest creatives of each brand also go into the AI video analysis, so the result becomes a learning for the next brief.
FAQ
Isn't CTR a good lead KPI for traffic?
CTR shows how often people click, not what a click costs. Two creatives with the same CTR can have very different CPCs if their CPMs differ. That is why CPC leads and link CTR runs alongside as a guardrail.
What if a campaign has several goals?
The platform still optimises for one goal per campaign or ad set, and that goal sets the lead KPI. Other wishes become guardrails or a separate campaign.
Why AWT and not simply views?
A view is defined differently on each platform, from 2 to 30 seconds. Average watch time measures how long people actually watch and compares creatives on one platform more fairly.
Can I use ROAS instead of CPO?
Yes, if revenue is passed back reliably. CPO is more robust because it only needs purchases. Ideally run both: CPO for efficiency, ROAS for value.